
Argentina’s nascent recovery

Sam Bidwell writes on Argentina’s nascent recovery.

“Milei promised to cut tax and spending, fire government employees, and get the economy moving again. 1 year on, it seems to be working”

In 2023, after decades of turmoil, Argentinians elected maverick libertarian Javier Milei as President.  Milei promised to cut tax and spending, fire government employees, and get the economy moving again. 1 year on, it seems to be working.

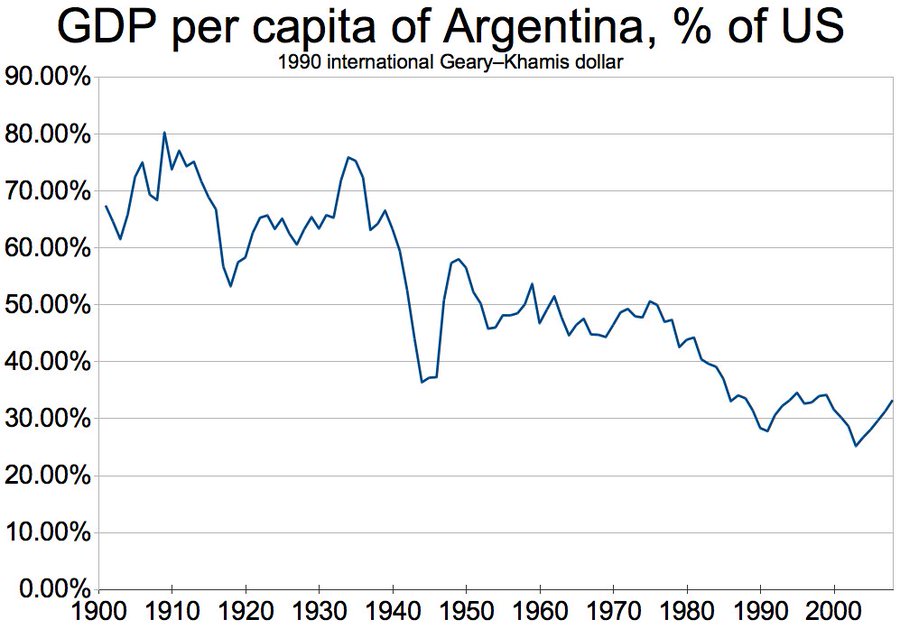
But first, some context.  In the early 20th century, Argentina had one of the highest per capita GDPs in the world – ahead of countries like France and Italy.  Thanks to decades of mismanagement, the economy is now in turmoil – in relative terms, it has declined steeply.
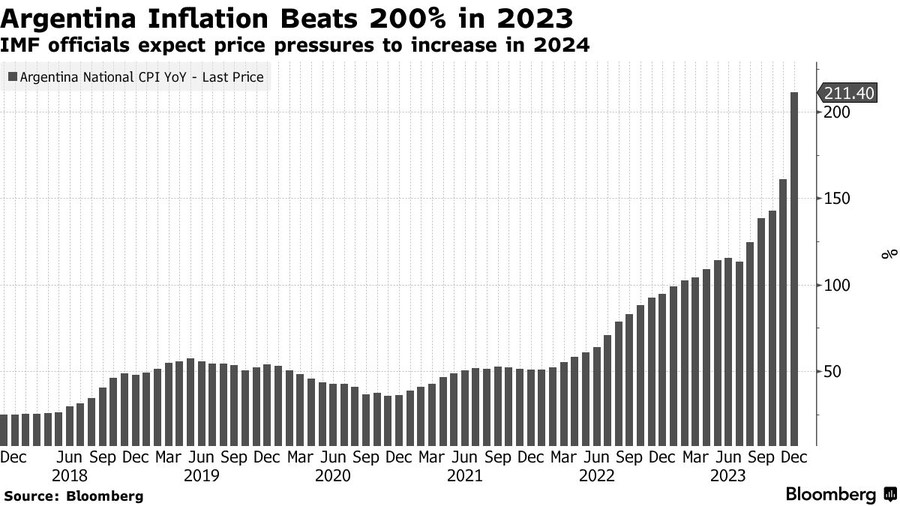
In January, year-on-year inflation had soared to an incredible 211 percent.  The country’s rapid inflation is largely the result of public spending. For years, the country has run large deficits, despite sluggish growth, in order to appease the public.

When the Government has been unable to cover the costs of this spending, it has borrowed or printed more money – resulting in inflation.  For ordinary Argentinians, this has driven up the cost of essential goods and created an environment in which businesses struggle to grow.
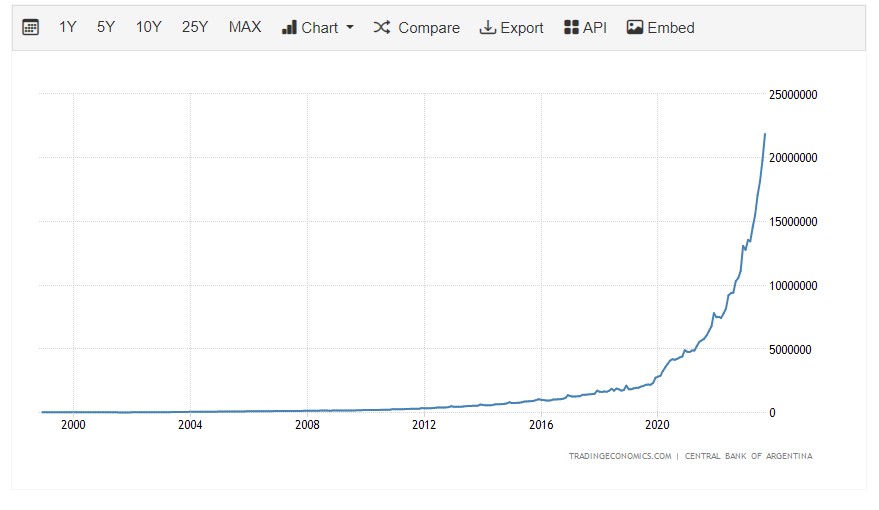
Because of this borrowing and printing, the country has entered into a vicious cycle of debt defaults.  Since 1980, it has defaulted on its debt five times – with the latest default coming in 2020.  This is an incredible decline for one of the world’s most promising economies.

“When the Government has been unable to cover the costs of this spending, it has borrowed or printed more money – resulting in inflation”

Enter Javier Milei.

Milei is an economics professor, and a self-described anarcho-capitalist, who was first elected to Congress in 2021.  He is known for his combative style, and for his contempt for the state. Incredibly, he also owns four clones of his beloved dog, Conan.

Milei emerged as a surprise candidate in the October 2023 Presidential race.  After a close first-round, Milei beat establishment politician Sergio Massa to triumph in the final ballot, on 19th November 2023. So what has the maverick libertarian achieved so far?

  • First, he has cut state spending – aggressively.
  • He has reduced the number of government departments in the country from 19 to 10.
  • His new Ministry of Human Capital merges the previous departments of Social Development, Education, Culture, and Labour.
  • He’s also fired thousands of government workers.

“He’s ending provision of free healthcare to immigrants in Argentina and introduced new fees for foreign university students”

When he took office, the Argentinian state had about 341,000 employees – today, that figure stands at 317,000, with thousands more cuts to come in the next few years.  Retained employees have seen pay freezes or cuts. 

He’s ended costly subsidies for energy, rent, and transport, while cutting non-essential local government funding.  He’s vetoed Congressional plans to introduce an ‘inflation lock’ on pensions in the country, and to increase funding for public universities.  And he’s also taken action on immigration.

He’s ending provision of free healthcare to immigrants in Argentina and introduced new fees for foreign university students.  He has also proposed plans to automatically deport foreign criminals from the country.

For Milei, Argentina is a country that needs to learn to live within its means, after decades of inflationary borrowing and spending.  With inflation under control, the country should be able to win back international investors, and grow the economy.

“For international investors, falling inflation is a sign that Argentina can once again be trusted as a place to spend money and grow businesses”

But is it working?

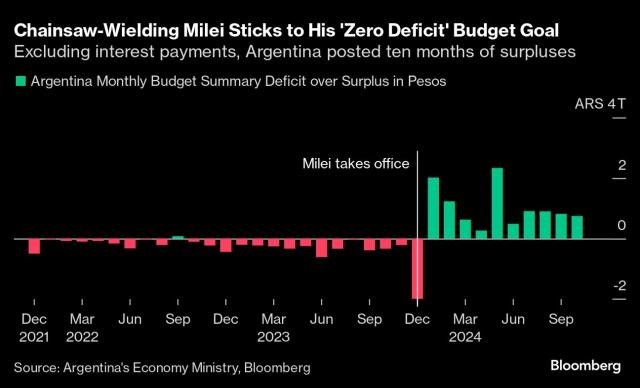
Well, the country’s budget deficit has finally turned into a surplus – meaning that Argentina has begun to get its debt repayments under control.  Month-to-month, the Argentinian government now spends less than its earns, setting the country back on the road to recovery.

As a result, inflation has started to fall.  For ordinary Argentinians, the price of everyday goods has begun to stabilise.  For international investors, falling inflation is a sign that Argentina can once again be trusted as a place to spend money and grow businesses.

The country’s most important stock index, the S&P MERVAL, tracks the performance of major Argentinian companies.  Since Milei took office, the MERVAL has reached record highs – indicating that investors are beginning to return to Argentina.

Meanwhile, the country’s risk profile has begun to fall, meaning that it could soon enjoy the same premiums as its South American neighbours. The country’s bonds have also hit record highs on international markets, again signalling growing investor confidence in the country.

“Milei ended rent controls across the country early in his tenure – and since that time, the supply of apartments in Buenos Aires has risen by 170%, while rents have fallen by 40%”

According to the IMF, Argentina is projected to grow 5% in 2025 and 4.7% in 2026.  That’s compared to 3% in neighbouring Brazil, and 2.1% in Chile – signalling that Argentina could truly be about to fulfil its enormous economic potential.
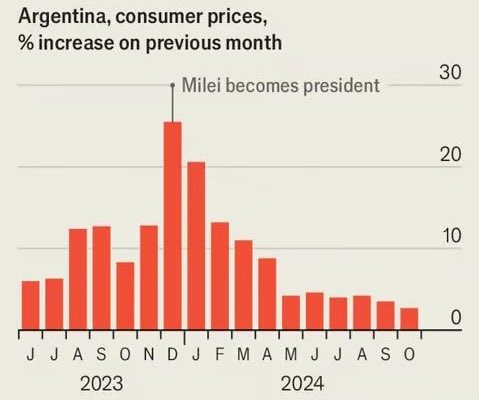
For many ordinary Argentinians, life is beginning to improve.  Milei ended rent controls across the country early in his tenure – and since that time, the supply of apartments in Buenos Aires has risen by 170%, while rents have fallen by 40%.  As a result, Milei is popular.

Despite his ‘shock therapy’, his party is leading in the polls for the 2025 legislative elections – and his approval rating stands at around 48%. Economic optimism is also on the rise and stands at the highest level since 2015. 

Of course, with three years left as President, Milei still has significant challenges ahead of him. Argentina’s incredible “Milei boom” shows what politicians can achieve with sufficient commitment.  It also shows us what can happen when the state gets out of the way.

By cutting burdensome regulations, reducing unnecessary spending, and challenging political orthodoxy, Milei looks set to turn around Argentina’s ailing economy.  Politicians across the world could learn from Milei’s example – we should all dare to challenge received wisdom.

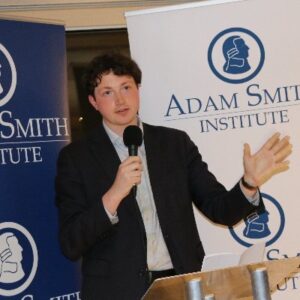
Reproduced with kind permission of Sam Bidwell, Director of the Next Generation Centre at the Adam Smith Institute, Associate Fellow at the Henry Jackson Society, although views are his own.  Sam can be found on X/Twitter, on Substack, and can be contacted at s.bidwell.gb@gmail.com.  This article was originally published as a X/Twitter Thread at https://x.com/sam_bidwell/status/1866594098964005206
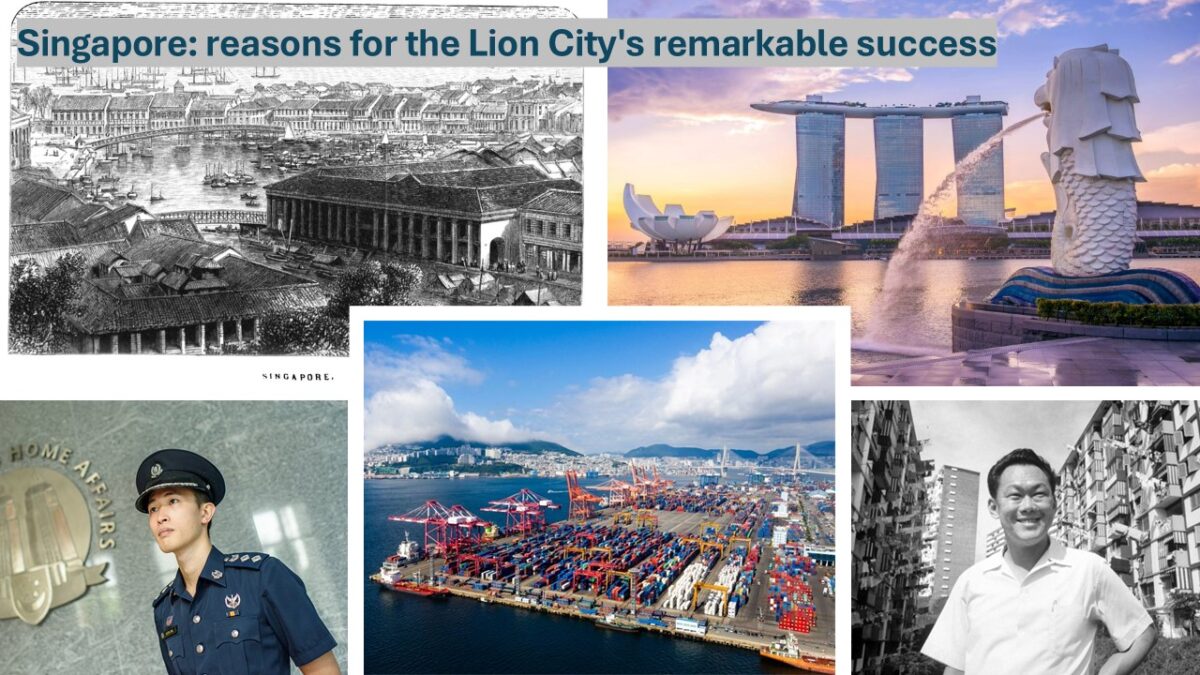
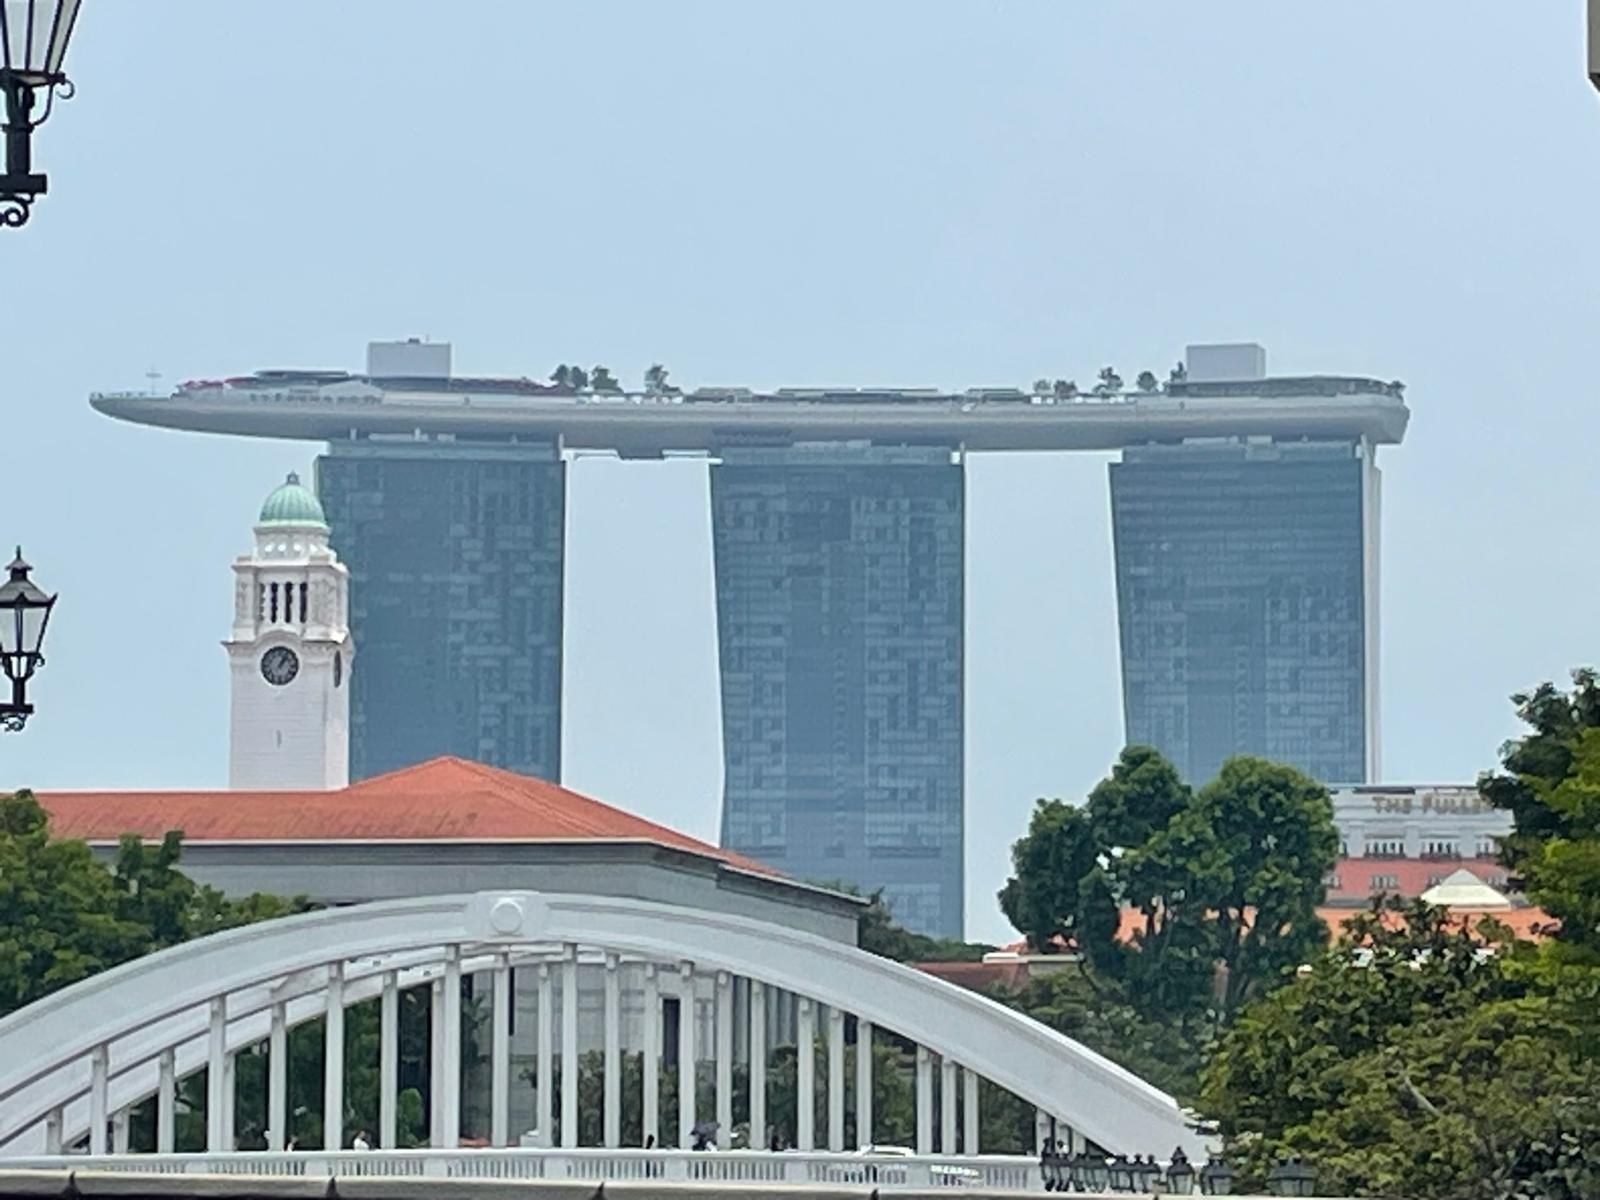
Singapore: reasons for the Lion City’s remarkable success

Sam Bidwell writes on the success of Singapore.

“Singapore was born – a poor city state, surrounded by enemies, and with no natural resources of its own. Yet today, Singapore is one of the world’s richest and most successful nations”

Today, Singapore is: – the safest city in the world – the world’s freest economy – #1 in the Ease of Doing Business Index But why has Singapore been so successful, and why is it such a great place for businesses? A on the reasons for the Lion City’s remarkable success.

First, some history. In 1819, Singapore was founded by Sir Stamford Raffles, a British official who believed that the site was perfect for a trading post. The city grew quickly, attracting traders from across the region who were drawn to the city’s ‘free port’ status.

Singapore was governed by the British until 1963, when the city became independent as part of the ‘Federation of Malaya’. However, the union was not a harmonious one. Due to political disputes – including race riots in 1964 -, Singapore was expelled from Malaya in 1965.

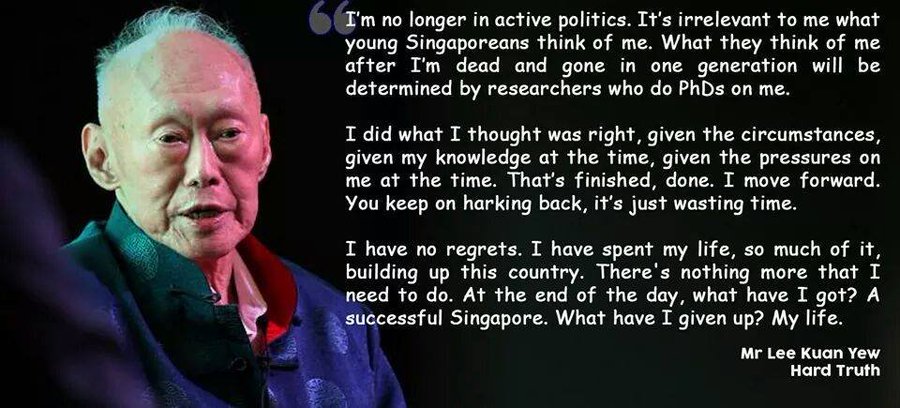
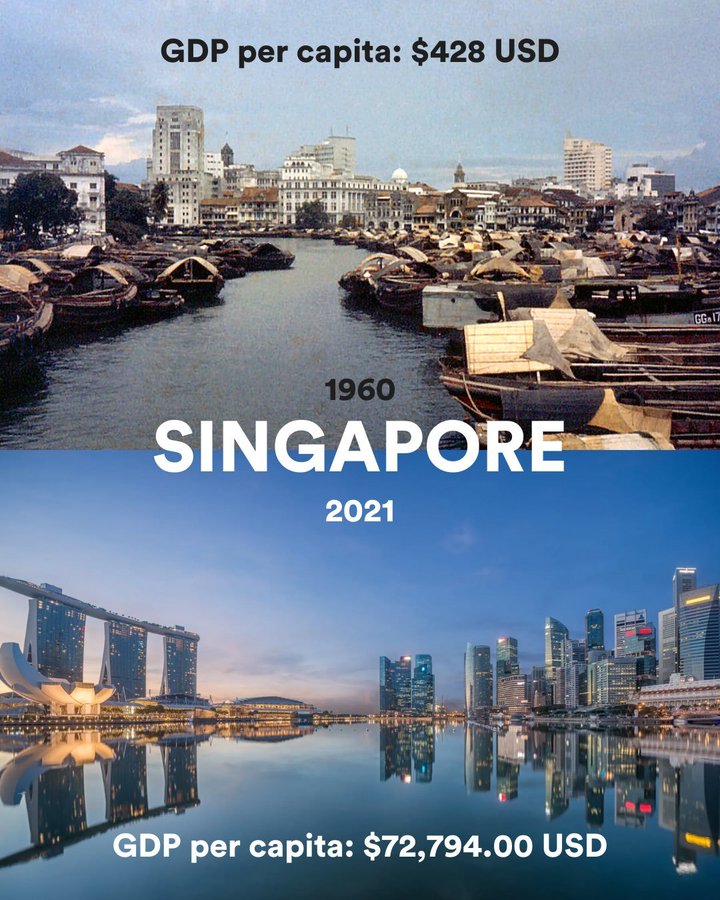
And so, Singapore was born – a poor city state, surrounded by enemies, and with no natural resources of its own. Yet today, Singapore is one of the world’s richest and most successful nations, thanks largely to the work of its visionary founding father, Lee Kuan Yew.

A graduate of the University of Cambridge, Lee had initially tried to make a success of Singapore’s position within Malaya. But with independence forced upon him, he worked to build the ideal “start-up” nation in Singapore, using the city’s natural strengths to his advantage.

“Over 99 percent of all imports to Singapore are duty free. Corporation tax is charged at a flat rate of 17%, and the city has no capital gains tax.”

He was ruthlessly pragmatic in pursuit of his vision. His decisions were guided by empiricism rather than ideology. As a result, Singapore grew from an obscure post-colonial backwater into a world-leading city. What exactly did Lee do?

First, he recognised that Singapore’s openness to business and trade could be one of its greatest strengths. Over 99 percent of all imports to Singapore are duty free. Corporation tax is charged at a flat rate of 17%, and the city has no capital gains tax.

Thanks to efficient processes, it takes an average of 1.5 days to set up a business in Singapore, and just 15 minutes to register a company online. That’s alongside strong IP protections and light-touch regulation – many businesses have their Asia-Pacific hub in Singapore.

In order to make Singapore attractive to global businesses, Lee Kuan Yew insisted that English would be the main language of administration in the city. Alongside English, Singaporeans also learn a ‘mother tongue’ – Mandarin, Malay, or Tamil – depending on their heritage.

But low taxes and English proficiency alone would not be enough to guarantee Singapore’s success. The city also has world-leading infrastructure, designed with comfort and ease in mind. Singapore’s port is the second busiest in the world in terms of total shipping tonnage.

Meanwhile the city’s airport, Changi, is consistently rated as one of the best in the world. Changi Airport serves more than 100 airlines flying to more than 400 cities worldwide. It is clean, comfortable, and modern, designed to ensure efficient layovers and speedy boarding.

“One of the tragic illusions that many countries of the Third World entertain is the notion that politicians and civil servants can perform entrepreneurial functions.”

Within the city itself, travellers can get around using the fully automated Mass Rapid Transit network – a clean and comprehensive urban transit system, complete with functional Wi-Fi. Meanwhile the city’s roads are rated as amongst the best in the world.

Much of this infrastructure is funded and maintained by Temasek, an investment firm owned by the Singapore Government. Alongside GIC, Singapore’s other sovereign wealth fund, Temasek operates like a private company, managing many of the Government’s assets.

Temasek uses private sector incentives in the public interest. “One of the tragic illusions that many countries of the Third World entertain is the notion that politicians and civil servants can perform entrepreneurial functions.” – Dr Goh Keng Swee, 1st Finance Minister

Singapore also has a zero-tolerance approach to crime, with impartial and efficient enforcement of strict laws. Chewing gum is banned in the country, and littering can result in an on-the-spot fine. Vandalism and drug use can result in harsh penalties, including caning.

These laws, alongside an efficient system of municipal government, makes Singapore the world’s cleanest and safest city. Singaporeans regularly leave their phones as placeholders in public places – a civic culture of cleanliness and orderliness is extolled at every level.

Singapore also invests in its people and maintains genuinely meritocratic systems for hiring and firing. The Government consistently invests in education. At schools, at universities, and in public life, Singaporeans venerate intellectual ability and promote those who succeed.

Its political system is meritocratic too, prizing stability and talent. Though Singapore holds free multiparty elections, the Government maintains control over the political process. Protest is strictly controlled, and the press is regulated to prevent seditious acts and speech.

“Stability, low taxes, an efficient state, and an uncompromising approach to public order. These are the roots of Singapore’s success”

The result is the most stable political system in Asia, and amongst the most stable countries in the world. The People’s Action Party, founded by Lee Kuan Yew, has led Singapore since 1965, ensuring stability and continuity across the decades.

Public figures – civil servants and politicians – are paid well, to ensure that the best and brightest are attracted into Government. The Prime Minister of Singapore earns about ten times more than the UK’s Prime Minister, and about four times as much as the US President.

But Singapore also has a zero-tolerance approach to corruption. Public officials who take bribes while in office are removed from their post, fined, and often jailed. Just this week, the country’s former Transport Minister has been convicted of receiving gifts while in office.

Stability, low taxes, an efficient state, and an uncompromising approach to public order. These are the roots of Singapore’s success. In building Singapore, Lee Kuan Yew was not guided by ideology, but by what works. He was a pragmatic empiricist through and through.

Lee’s story is a reminder that national success is largely the product of pragmatism, competence, and vision. By studying what works in practice and implementing it, we can change society for the better. No obstacle is too big if we set our minds to the task of national revival.

The great man himself puts it best: The lessons of Singapore and Lee Kuan Yew should inspire us all.

Reproduced with kind permission of Sam Bidwell, Director of the Next Generation Centre at the Adam Smith Institute, Associate Fellow at the Henry Jackson Society, although views are his own.  Sam can be found on X/Twitter, on Substack, and can be contacted at s.bidwell.gb@gmail.com.  This article was originally published as a X/Twitter Thread at https://x.com/sam_bidwell/status/1839676939444875461?s=46.

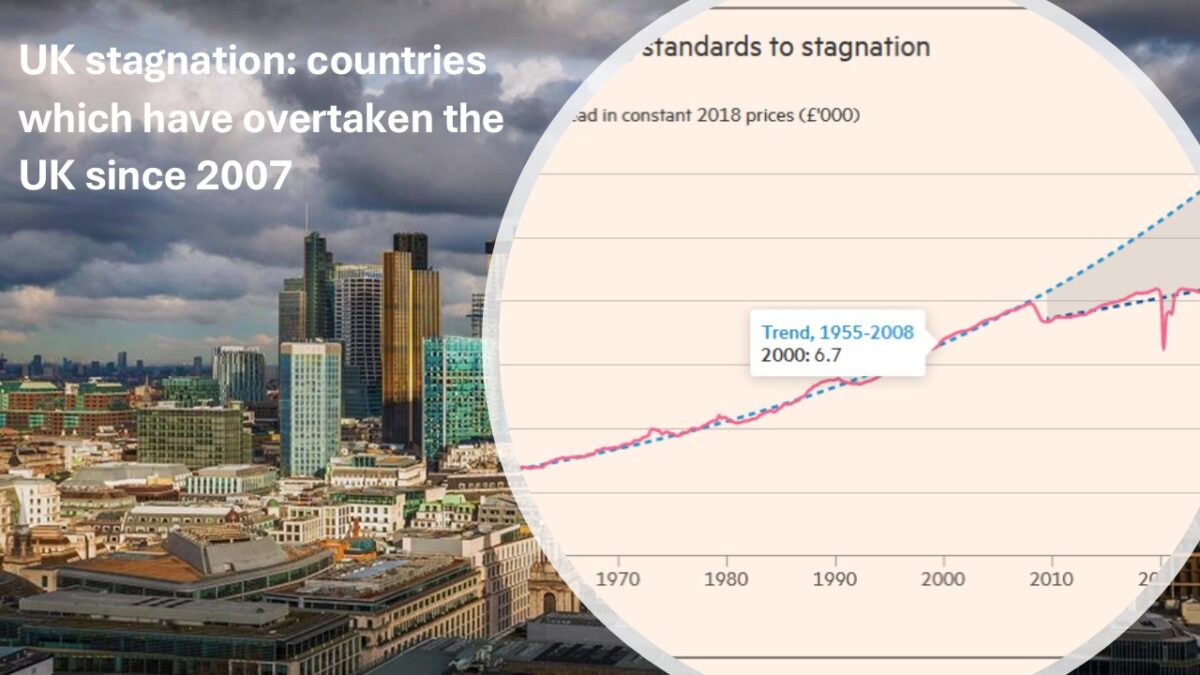
UK stagnation: countries which have overtaken the UK since 2007.

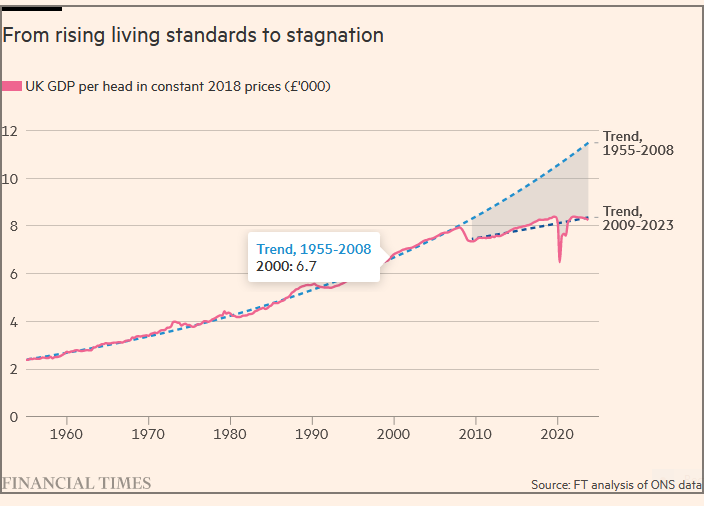
The UK’s economy has stagnated since 2008. In terms of GDP per capita – economic output divided by the number of people in a country – we’ve actually gone backwards. Sam Bidwell gives an overview of the countries that the UK was richer than in 2007, but which have since overtaken us…

“None of this was inevitable. Our economic stagnation was the result of policy choices made by successive governments”

  • UK GDP per Capita, 2007: $50,397
  • Singapore GDP per Capita, 2007: $39,432
  • UK GDP per Capita, 2023: $48,866
  • Singapore GDP per Capita, 2023: $84,734

In 2007, the UK was richer than Singapore, southeast Asia’s Lion City – today, it is much, much poorer.

  • UK GDP per Capita, 2007: $50,397
  • USA GDP per Capita, 2007: $48,050
  • UK GDP per Capita, 2023: $48,866
  • USA GDP per Capita, 2023: $81,695

In 2007, the UK was (slightly) richer than the United States, the world’s economic superpower. Today, it is far poorer.

  • UK GDP per Capita, 2007: $50,397
  • Australia GDP per Capita, 2007: $41,051
  • UK GDP per Capita, 2023: $48,866
  • Australia GDP per Capita, 2023: $64,711

In 2007, the UK was richer than Australia, a world-leading mining economy. Today, it is much poorer.

  • UK GDP per Capita, 2007: $50,397
  • Austria GDP per Capita, 2007: $46,915
  • UK GDP per Capita, 2023: $48,866
  • Austria GDP per Capita, 2023: $56,506
In 2007, the UK was richer than Austria, a highly developed social market economy. Today, it is poorer.

  • UK GDP per Capita, 2007: $50,397
  • Belgium GDP per Capita, 2007: $44,319
  • UK GDP per Capita, 2023: $48,866
  • Belgium GDP per Capita, 2023: $53,475

“When you see crumbling infrastructure, poor public services, or stagnant job opportunities, you’re seeing these two lost decades of growth”

In 2007, the UK was richer than Belgium, a developed services economy and home of the EU. Today, it is poorer. {Editors note: Taking money from hard working citizens of the EU does help}.

  • UK GDP per Capita, 2007: $50,397
  • Finland GDP per Capita, 2007: $48,467
  • UK GDP per Capita, 2023: $48,866
  • Finland GDP per Capita, 2023: $53,755

In 2007, the UK was richer than Finland, a powerhouse in electronics manufacturing. Today, it is poorer.

  • UK GDP per Capita, 2007: $50,397
  • Canada GDP per Capita, 2007: $44,659
  • UK GDP per Capita, 2023: $48,866
  • Canada GDP per Capita, 2023: $53,371

In 2007, the UK was richer than Canada, our oil-producing cousins across the Atlantic. Today, it is poorer.

  • UK GDP per Capita, 2007: $50,397
  • Germany GDP per Capita, 2007: $41,640
  • UK GDP per Capita, 2023: $48,866
  • Germany GDP per Capita, 2023: $52,745

In 2007, the UK was richer than Germany, Europe’s manufacturing powerhouse. Today, it is poorer.

  • UK GDP per Capita, 2007: $50,397
  • UAE GDP per Capita, 2007: $43,918
  • UK GDP per Capita, 2023: $48,866
  • UAE GDP per Capita, 2023: $52,976

In 2007, the UK was richer than the UAE, the Gulf state which plays host to futuristic cities like Dubai. Today, it is poorer.

  • UK GDP per Capita, 2007: $50,397
  • Hong Kong GDP per Capita, 2007: $30,593
  • UK GDP per Capita, 2023: $48,866
  • Hong Kong GDP per Capita, 2023: $50,696

“it doesn’t have to be this way. We were richer than these world-leading economies before, and we can do it again”

In 2007, the UK was much richer than Hong Kong, East Asia’s financial services superpower. Today, it is poorer.

  • UK GDP per Capita, 2007: $50,397
  • Israel GDP per Capita, 2007: $25,633
  • UK GDP per Capita, 2023: $48,866
  • Israel GDP per Capita, 2023: $52,261

In 2007, the UK was much richer than Israel, the Middle East’s high-tech hub. Today, it is poorer.

None of this was inevitable. Our economic stagnation was the result of policy choices made by successive governments since 2008. Our broken planning system, expensive energy, and a risk-averse regulatory culture have all contributed to nearly two lost decades of growth.

When you see crumbling infrastructure, poor public services, or stagnant job opportunities, you’re seeing these two lost decades of growth. The point is that it doesn’t have to be this way. We were richer than these world-leading economies before, and we can do it again.

Principally, this requires two things from our politicians. Honesty – about why we are where we are, and how we got here. And ambition – about what Britain can, and should, be. We deserve to be a high-tech, high-growth, high-powered economy again.

That means getting the basics right – housing, energy, infrastructure, public order, migration. Let’s start building things again and stop relying on low-skilled labour. Dare to dream. We built the modern world before, and we can do it again. Anglofuturism now.

Reproduced with kind permission of Sam Bidwell, Director of the Next Generation Centre at the Adam Smith Institute, Associate Fellow at the Henry Jackson Society, although views are his own.  Sam can be found on X/Twitter, on Substack, and can be contacted at s.bidwell.gb@gmail.com.  This article was originally published as a X/Twitter Thread at https://x.com/sam_bidwell/status/1832062722412015803.

Dubai’s transformation: shrewd investments and a business-friendly environment

“Dubai’s remarkable growth is the product of shrewd investments, business-friendly tax and regulatory rules”

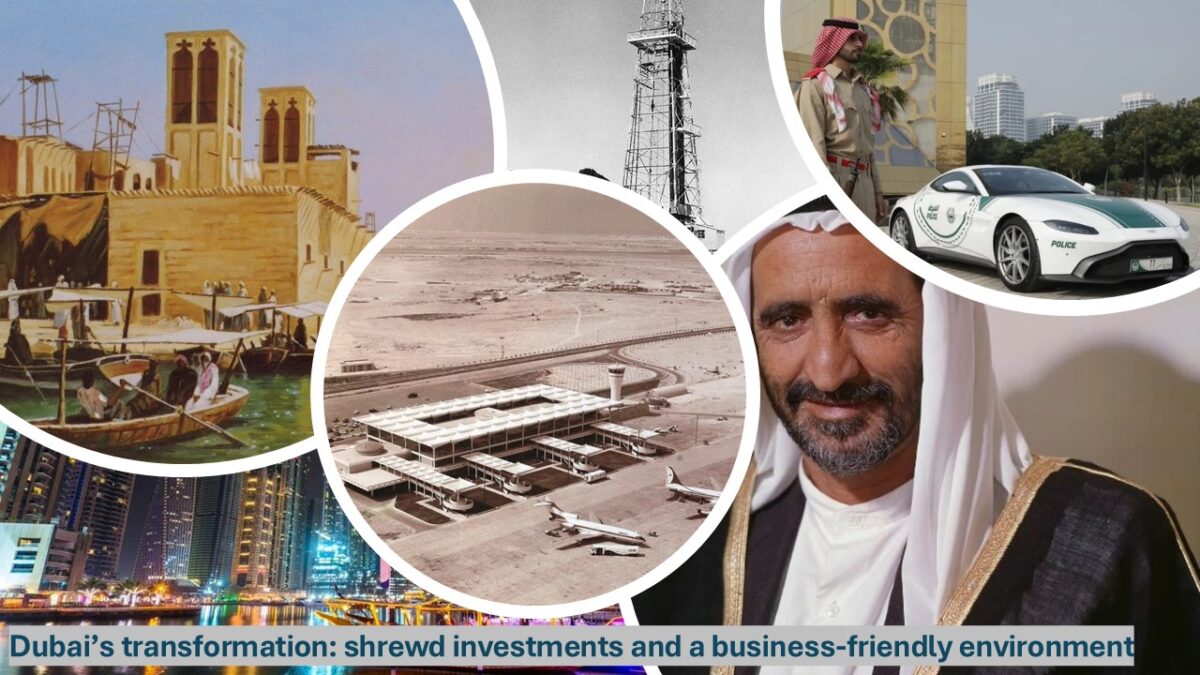
In just fifty years, Dubai has transformed from an obscure fishing village into a city of global significance.

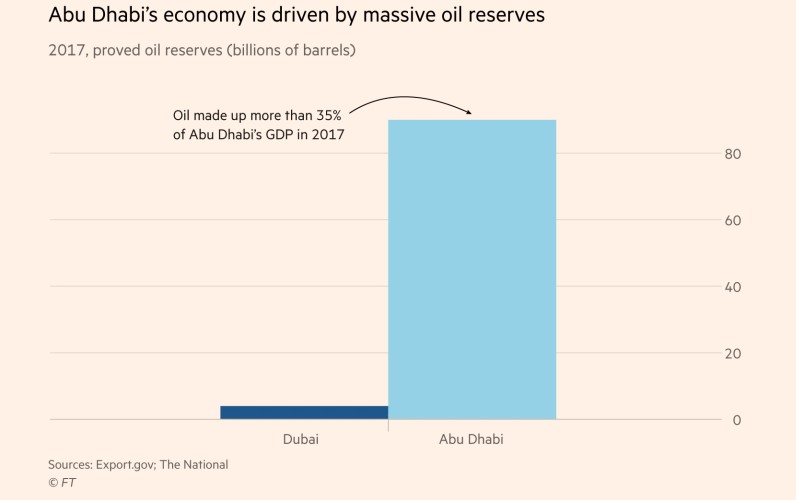
Despite popular misconceptions, oil revenues contribute less than 1% of Dubai’s GDP today.  You read that right – unlike nearby Abu Dhabi, Dubai’s economy is not powered by oil revenues. In fact, Dubai’s remarkable growth is the product of shrewd investments, business-friendly tax and regulatory rules, and an uncompromising approach to political stability.

Modern Dubai was founded as a fishing village on the Persian Gulf at some point in the 18th century. Throughout the early 19th century, Dubai – as well as other neighbouring Gulf states – fell under British influence. In 1820, these small Gulf states fell under a British protectorate.

“In 1901, Sheikh Makhtoum bin Hasher Al Makhtoum established Dubai as a free port, with no tariffs on imports or exports”

As early as 1900, Dubai began to emerge as an important port. Its location at the mouth of the Persian Gulf made it ideal for trading into the Middle East, India, and East Africa. This geographic advantage, and its openness to commerce, has been the secret to Dubai’s success.

In 1901, Sheikh Makhtoum bin Hasher Al Makhtoum established Dubai as a free port, with no tariffs on imports or exports. Merchants, particularly those working in the pearl industry, were given parcels of land, guarantees of protection, and religious toleration.

In the first half of the 20th century, Dubai grew in importance as a hub for trade with Persia and India. However, the city’s position was supercharged with the emergence of a new leader. In 1957, Rashid bin Saeed Al Makhtoum succeeded his father to become ruler of Dubai.

Sheikh Rashid understood the young city’s potential. He set about transforming Dubai from a small coastal settlement into a modern port city. He also understood the keys to Dubai’s success – openness to trade, infrastructure investments, stability and order.

“In 1966, more gold was shipped from London to Dubai than almost anywhere in the world”

He set about creating private companies to build and operate infrastructure. In 1959, he established Dubai’s first telephone company; by 1961, it had rolled out an operational network. The city’s private water company established a regular supply of piped water by 1968.

By 1960, the city’s airport had opened, with flights operating across the Middle East. In 1963, the Sheikh opened the first bridge across Dubai Creek, paid for by tolls. The airport was expanded in 1965 to enable long-haul flights and was expanded again in 1970.

By the late 1960s, Dubai was also a hub for the global gold trade – much of which was based on the illegal sale of gold to India. In 1966, more gold was shipped from London to Dubai than almost anywhere in the world (only France and Switzerland took more).

And again, this is all before the discovery of oil. By the time that Dubai struck it rich in 1966, it was already a growing port, with a solid base of infrastructure and a low-tax, pro-business environment. Of course, the discovery of oil supercharged Sheikh Rashid’s vision.

“Roads, bridges, hospitals, and schools were constructed in a construction glut which propelled Dubai’s economy through the 1980s. As the old saying goes, build it and they will come”

But Sheikh Rashid had the foresight to know that one day, the oil would run out. He understood that one day, the city would need to survive without oil – and so set about making Dubai a world-leading hub for regional and international commerce.

In 1972, Port Rashid was constructed and in 1979, it was followed by the Port of Jebel Ali, today the busiest in the Middle East. In 1978, Sheikh Rashid opened the Dubai World Trade Centre. Dubai Creek was dredged and widened in the early 1970s. In 1983, Dubai Drydocks opened.

Meanwhile the city’s airport was expanded, and hotels were opened for business travellers. Roads, bridges, hospitals, and schools were constructed in a construction glut which propelled Dubai’s economy through the 1980s. As the old saying goes, build it and they will come.

This infrastructure-first approach was the foundational principle of Dubai’s pro-business policy environment. By leveraging the city’s geography and encouraging businesses to invest, Dubai made itself into one of the Middle East’s leading trade entrepôts.

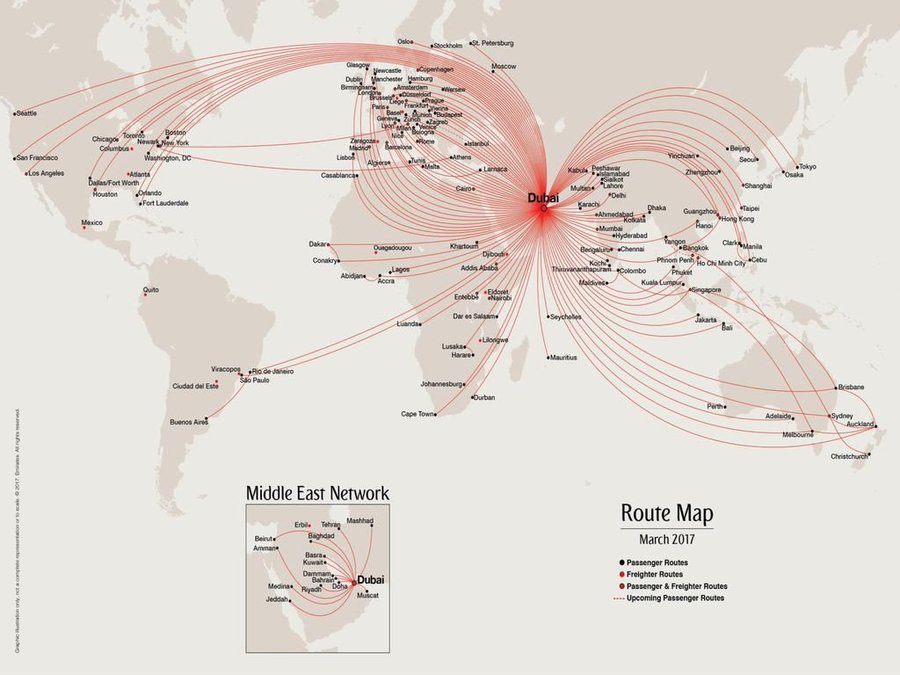
The city sits at the mouth of the oil-rich Persian Gulf, with convenient maritime connections to Asia, Europe, and Africa. By air, more than 50% of the world’s population is 7 hours or less from Dubai – again, ideal geography for an international business hub.

“26 free trade zones, companies enjoy a 50-year corporation tax exemption, and no international tariffs. Many of these free trade zones use English common law”

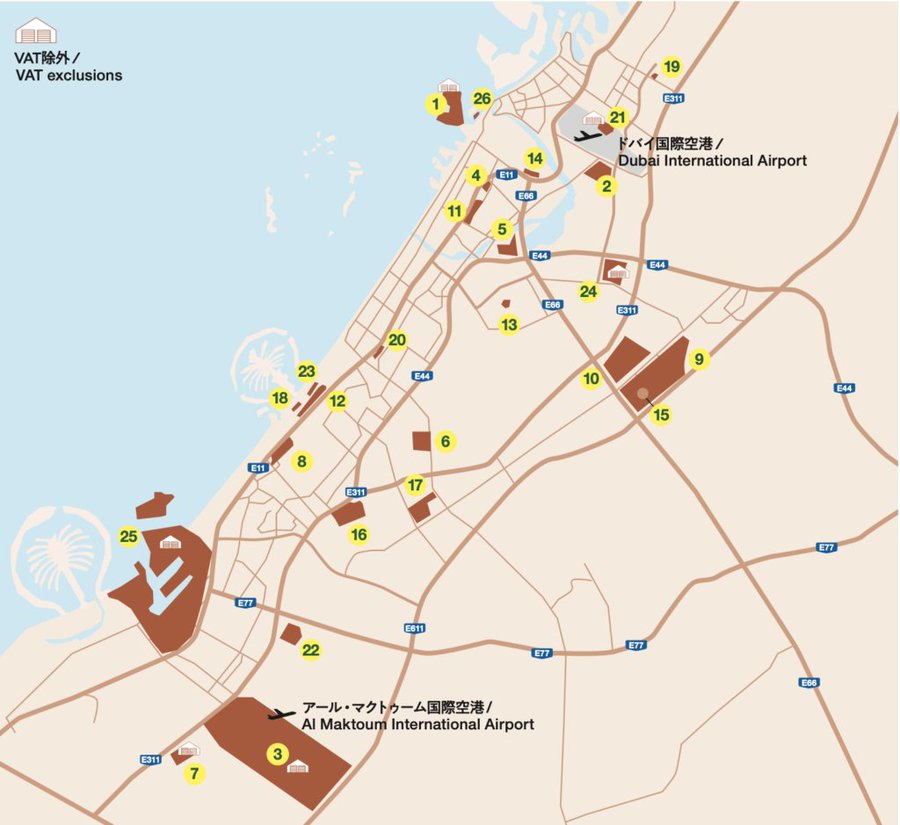
However, it’s not just geography and infrastructure. Dubai has no income tax. Corporation tax is low at 9% – and in 26 free trade zones, companies enjoy a 50-year corporation tax exemption, and no international tariffs. Many of these free trade zones use English common law.

These zones create an extremely business-friendly environment – many international businesses have their regional or global HQs in Dubai. At the same time, the state invests in the infrastructure – roads, schools, hospitals – needed to keep business travellers coming.

And speaking of business travellers, Dubai – and the rest of the United Arab Emirates – is home to a large number of foreigners. In fact, 88% of the UAE’s population are expats. The territory’s tax-free status and world-leading infrastructure attracts high net-worth individuals.

However, unlike in Europe, immigrants in Dubai live under strict conditions. They do not benefit from state welfare and can be deported at any time. It is almost impossible to become a naturalised citizen. In return, migrants get to make far more money than they would at home.

This is particularly true for low-skilled migrants, often from South Asia, who come to the country under the so-called ‘kafala system’. Under the kafala system, all migrant workers need to have an Emirati sponsor – if their employment ends, so does their residence.

Which brings me onto the final aspect of Dubai’s success – law and order. The city has a zero-tolerance approach to crime and public disorder. The Dubai Police employs drones and has an average emergency response time of 2 minutes and 24 seconds, as of Q3 2023.

“Despite popular misconceptions, its rapid rise owes just as much to sensible policymaking as to oil. Not everybody can turn a patch of desert into a global megacity!”

Sheikh Rashid passed away in 1990. He was succeeded by his son, Maktoum, who ruled until 2006. In turn, Maktoum was succeeded by his brother Mohammed, who rules Dubai to this day. Though Dubai has grown considerably since Sheikh Rashid’s time, the basic principles are the same.

In many ways, the principles that built modern Dubai are the same as those that built Hong Kong, Singapore – or even, historically, London.

  • Openness to business
  • Ideal strategic positioning
  • Shrewd investments in infrastructure
  • Pragmatic governance
  • Law and order

Whatever you think of Dubai, the city’s growth is one of the most incredible stories of the 20th century.  Despite popular misconceptions, its rapid rise owes just as much to sensible policymaking as to oil. Not everybody can turn a patch of desert into a global megacity!

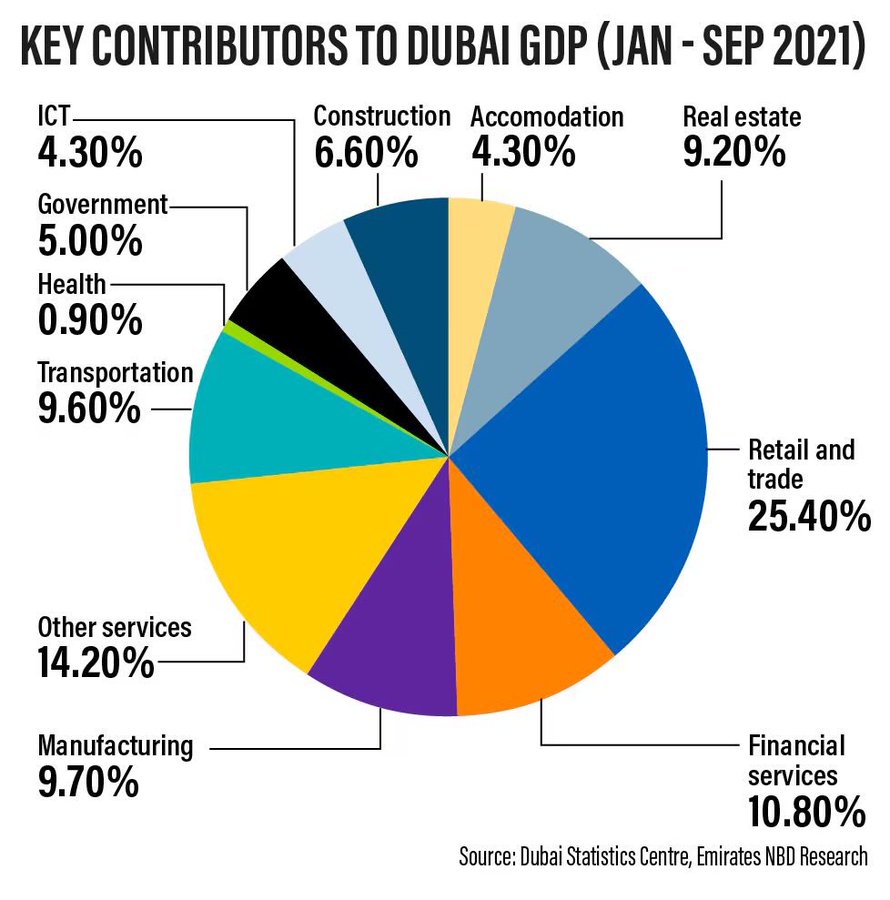
Yes, it really is true – as of today, less than 1% of Dubai’s GDP is generated by oil revenues. In fact, it’s commerce, financial services, real estate, and transportation that are the biggest drivers. The ultimate service economy!

Reproduced with kind permission of Sam Bidwell, Director of the Next Generation Centre at the Adam Smith Institute, Associate Fellow at the Henry Jackson Society, although views are his own.  Sam can be found on X/Twitter, on Substack, and can be contacted at s.bidwell.gb@gmail.com.  This article was originally published as a X/Twitter Thread at https://x.com/sam_bidwell/status/1827802745740337507

Hong Kong, from small port to global finance centre

“Hong Kong transformed from a second-rate port city into a global centre of finance and commerce. But how did it achieve this?”

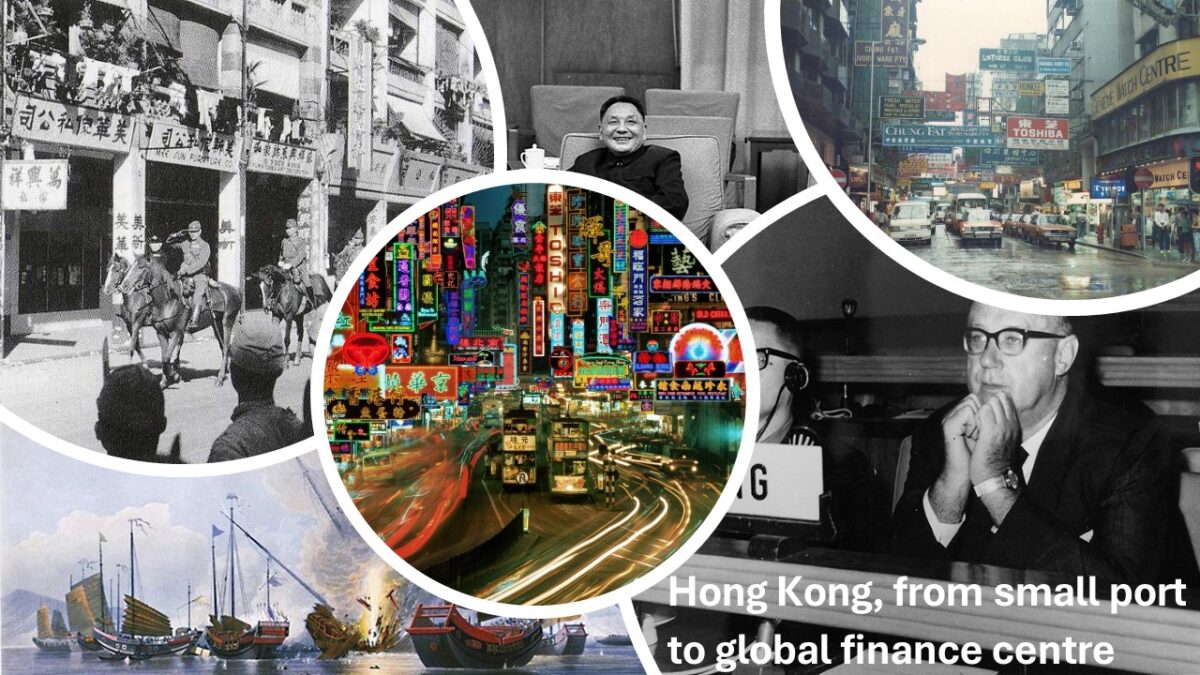
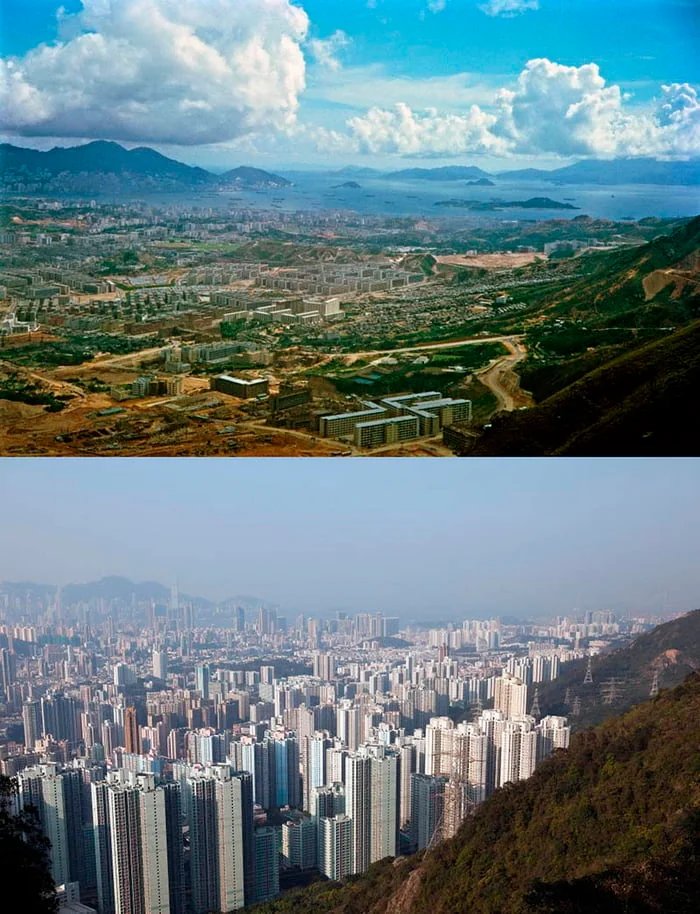
In the 20th century, Hong Kong transformed from a second-rate port city into a global centre of finance and commerce. But how did it achieve this? An overview of the use of ‘positive non-interventionism’, the economic philosophy which powered Hong Kong’s rise to greatness.

Hong Kong Island was ceded to Britain in 1842, in the wake of the First Opium War. Its strategic location was ideal for projecting British military and economic power into south China.  At the time, it was home to around 5,000 people, spread across several small fishing villages.

The city grew quickly, powered by trade with China and British financial interests in East Asia. By 1859, the island was home to some 85,000 Chinese residents, alongside 1,600 foreigners.  In 1865, the now world-famous HSBC was founded in Hong Kong.

The Kowloon Peninsula was added to the territory in 1860, and the so-called ‘New Territories’ were obtained in 1898 under a 99-year lease.  Thanks to the legal and political stability offered by the British, Hong Kong’s role as a trade entrepot continued to grow.

By the outbreak of the Second World War in 1939, Hong Kong was central to British interests in East Asia. The territory operated as a free port, with no tariffs on imports, which attracted merchants from China and Europe alike.  And then came the Japanese.

In 1941, Hong Kong was occupied by the Japanese after eighteen days of fierce fighting.  Japanese occupation was brutal. Civilians were regularly targeted for mass execution, banking assets and factories were seized, and a harsh rationing regime was imposed on the territory.

“he ensured that Hong Kong was granted financial autonomy from the UK, giving HK more freedom to make its own policy. He also resisted calls for a centrally planned industrial strategy”

On August 30th 1945, Hong Kong was liberated, and British control was restored. This is where Hong Kong’s remarkable rise really begins.  In 1946, Sir Geoffrey Follows was appointed as the territory’s Financial Secretary and charged with recovering from the occupation.

Follows oversaw a rapid short-term recovery of Hong Kong’s fortunes. In October 1948, he ensured that Hong Kong was granted financial autonomy from the UK, giving HK more freedom to make its own policy. He also resisted calls for a centrally planned industrial strategy.

In 1949, the Communist Party of China emerged victorious from the Chinese Civil War. Capitalists, Chinese nationalists, and political dissidents who feared communist rule fled to Hong Kong.  From 1945 to 1951, the territory’s population increased from 600,000 to 2.1 million.  Follows’ emphasis on free trade and stability, alongside the cheap labour and expertise of these new migrants, laid the groundwork for Hong Kong’s economic miracle.

What was the ‘positive non-interventionism’ which shaped the approach of the next three Financial Secretaries?  In short, ‘positive non-interventionism’ starts from the observation that Government efforts to shape resource allocation are usually damaging to growth, particularly in the private sector.

That’s the ‘non-interventionism’ – but what about the ‘positive’?  Successive Hong Kong Governments recognised that the state can take positive steps to ensure improved market function – such as investing in infrastructure, maintaining law and order, and providing legal and political stability.  That’s the ‘positive’ part.

“The territory had no income tax, and instead raised revenue through land value capture”

What did this look like in practice?

The territory’s next Financial Secretary was Arthur Grenfell Clarke (1952-61). Clarke refused to introduce regulation of the Hong Kong Stock Exchange, and the territory operated without a central bank or monetary policy.

The territory had no income tax, and instead raised revenue through land value capture.

At the same time, Clarke worked with his colleagues in Government to expand Kai Tak Airport, improve the Hong Kong Police Force, and crack down on triad-led gang crime.

“From 1961 to 1971, Government spending as a percentage of GDP fell from 7.5% to 6.5%. At the same time, real wages rose by 50% and acute poverty fell from 50% to 15%”

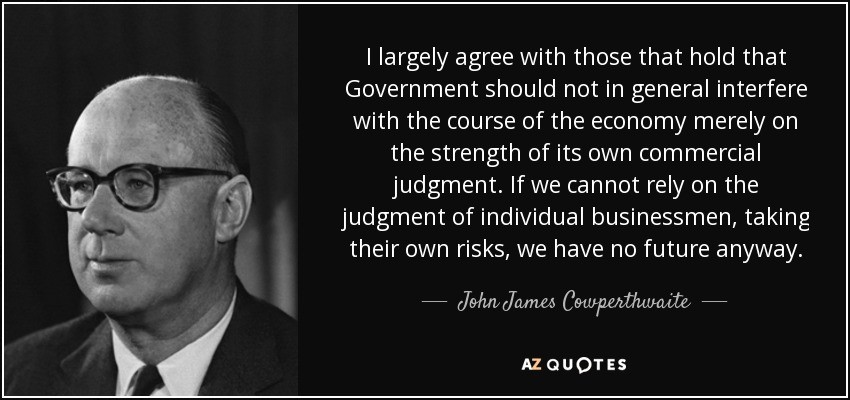
Yet the real star of the show is John James Cowperthwaite, the city’s Financial Secretary from 1961 to 1971.   From 1961 to 1971, Government spending as a percentage of GDP fell from 7.5% to 6.5%. At the same time, real wages rose by 50% and acute poverty fell from 50% to 15%.

Under Cowperthwaite, the territory imposed no controls at all on international capital flows. He refused to collect GDP statistics, fearing that these would only be used to enable economic planning.  Taxes were kept low, and Government focused on basic infrastructure delivery.

Hong Kong grew rapidly, powered by manufacturing, shipping, finance, and construction. The number of factories in the territory increased from 3,000 to 10,000 over Cowperthwaite’s tenure, while the number of foreign companies registered in HK almost doubled.

This approach was continued by Cowperthwaite’s successor, Philip Haddon-Cave. Indeed, Haddon-Cave coined the term ‘positive non-interventionism’ in 1980.  In 1975, Hong Kong emerged as the world’s freest economy, a position that it held continually in 2019.

Haddon-Cave worked with Governor Murray MacLehose to improve services without increasing taxes, tariffs, or regulation.  The pair agreed that Government should focus on delivering a few basic services, and should draw on private sector expertise for delivery of major projects.

With this approach, the duo clamped down on corruption and launched the famous Mass Transit Railway.  They also managed Hong Kong’s rapid transition from a manufacturing economy to a services economy – prompted, in large part, by a major change just over the border.

In 1978, Chinese premier Deng Xiaoping launched the Open Door Policy, which saw China open up to foreign businesses.  In 1980, Deng designated the small city of Shenzhen, just across the border from Hong Kong, as a ‘Special Economic Zone’, in order to encourage foreign trade.  Like Hong Kong, Shenzhen would boom in the coming decades.

“Rather than damaging Hong Kong, the growth of cheap manufacturing in China allowed the territory to transform into a hub for financial and legal services”

In the 1980s, its growth was powered by manufacturing. The city’s low labour costs and high regulatory flexibility made it attractive for businesses looking to reduce their costs – including firms in Hong Kong.

Rather than damaging Hong Kong, the growth of cheap manufacturing in China allowed the territory to transform into a hub for financial and legal services, with immediate access to cheap goods and cheap labour from China. Costs remained low and growth remained steady.

“Hong Kong’s remarkable growth continued throughout the 1980s and 1990s, guided by positive non-interventionism”

For those wanting to access the lucrative Chinese market, Hong Kong was a perfect entry-point. The stability of Britain’s common law system and HK’s light touch regulation gave foreign businesses confidence that their investments would be protected.

Hong Kong’s remarkable growth continued throughout the 1980s and 1990s, guided by positive non-interventionism.  In 1997, HK was returned to China, after more than 150 years of British rule. Nevertheless, positive non-interventionism has continued to shape HK’s economic policies.

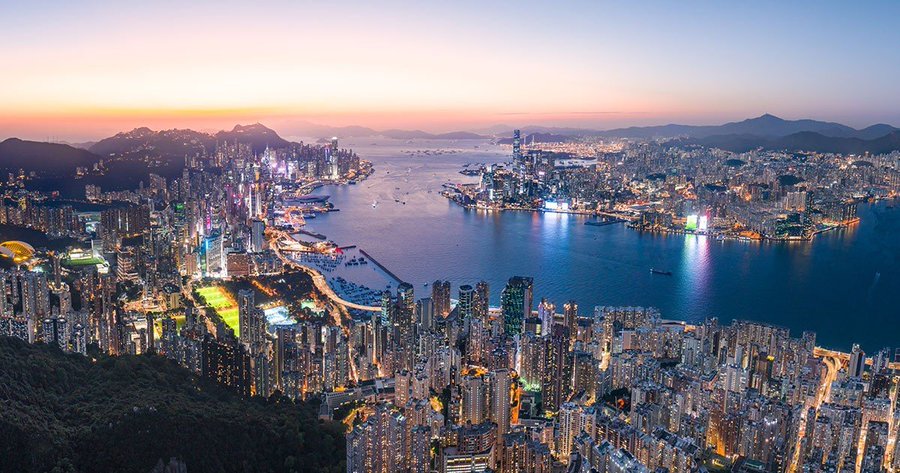
Though HK faces challenges today, it continues to stand as a global hub for financial and legal services.  Its remarkable story is testament to the power of free markets – but also to the importance of limited, effective government which focuses on stability and order.

Reproduced with kind permission of Sam Bidwell, Director of the Next Generation Centre at the Adam Smith Institute, Associate Fellow at the Henry Jackson Society, although views are his own.  Sam can be found on X/Twitter, on Substack, and can be contacted at s.bidwell.gb@gmail.com.  This article was originally published as a X/Twitter Thread at https://x.com/sam_bidwell/status/1817279031345352801

PopCon conversation with Dr. Arthur Laffer

On the 22nd July PopCon’s Mark Littlewood spoke with Dr. Arthur Laffer who influenced the economic thinking of great leaders including Ronald Reagan and Margaret Thatcher, and the man who the “Laffer curve” is named after.

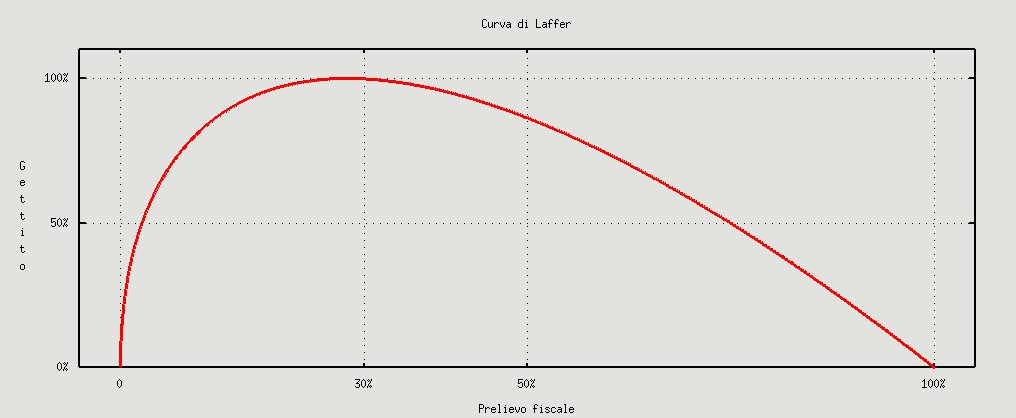
The Laffer curve illustrates the relationship between the rate of taxation and the resulting government revenue.  We’ve written about the curve as it related to events after Liz Trust and Kwasi Kwarteng were ousted in the autumn of 2022, and as part of a debate in Coulsdon in 2019.  The curve shows how lower tax rates can result in higher tax revenue.  The Tax Reform Council have a useful page displaying Global evidence: cutting income tax brings in more revenue.

A funny, enjoyable and fascinating interview that discusses the curve, many of Dr. Laffer’s experiences with major political figures and a history of economic changes.  Watch the video below:

You can find out more about the event at https://www.popularconservatism.com/popconversation_with_art_laffer and POPCON at https://www.popularconservatism.com/.

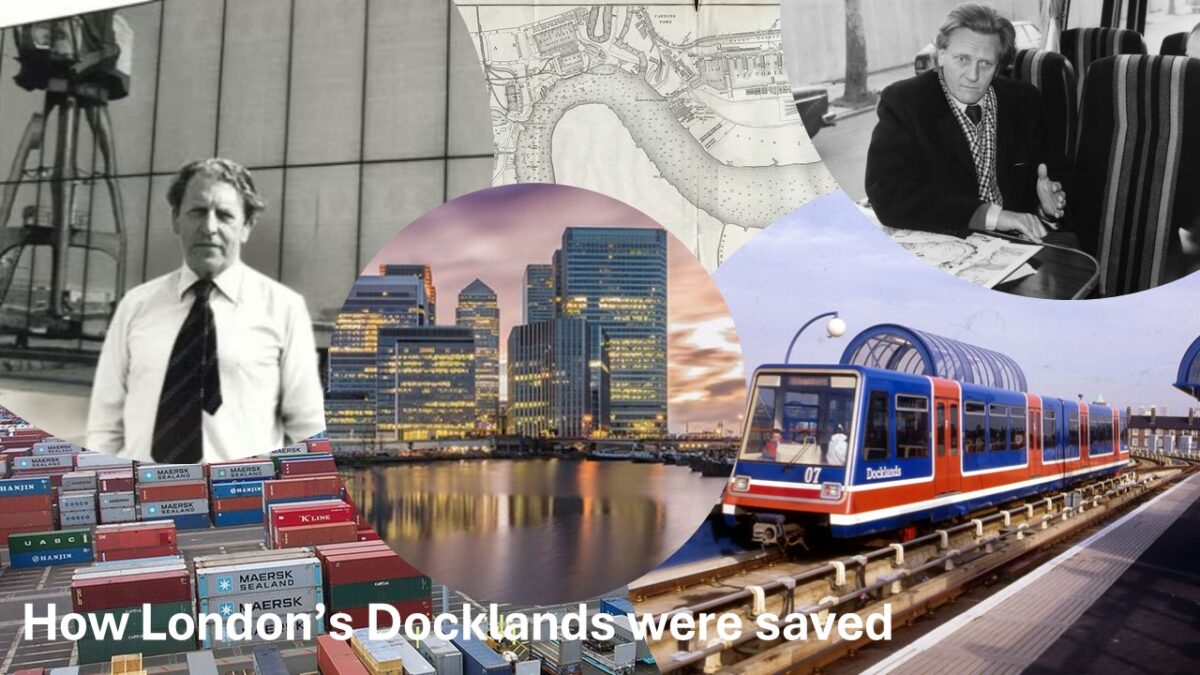
How London’s Docklands were saved

“Ships with goods from around the world, particularly from across the British Empire, were onshored and processed here. By 1900, London’s docks were the busiest in the world”

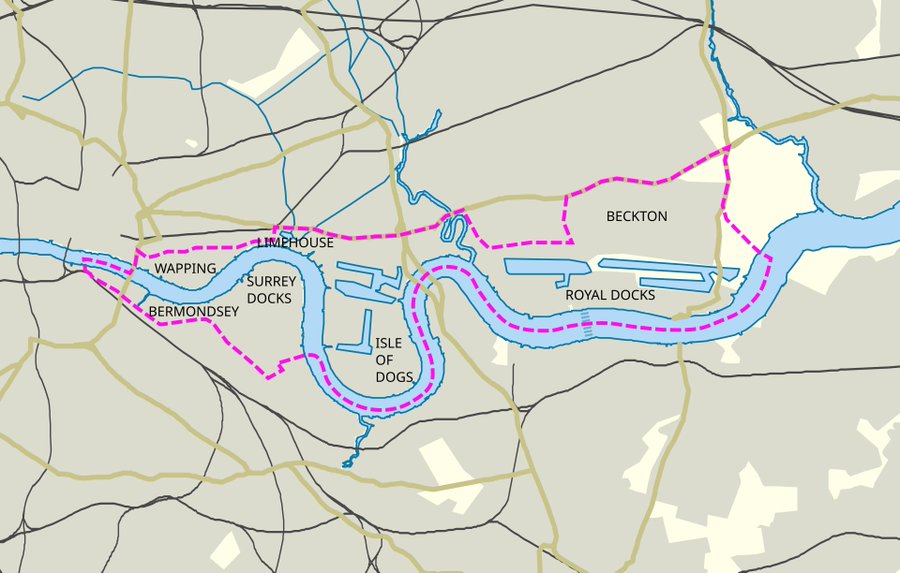
Once home to the largest port in the world, London’s Docklands had fallen into disrepair by the 1970s. Today, the Docklands is one of London’s most modern, attractive areas, home to a leading financial district and even an airport.

Throughout the 19th century, London’s Docklands grew rapidly, starting with West India Docks in 1802. Ships with goods from around the world, particularly from across the British Empire, were onshored and processed here. By 1900, London’s docks were the busiest in the world.

In March 1909, the separate docks were consolidated under the control of the Port of London Authority, which was responsible for management of the docks. Tens of thousands of people were employed here, and at nearby mills and factories which depended on the Docklands.

During the Second World War, the Docklands were heavily bombed in an effort to cripple Britain’s international supply chains. Much of the area’s infrastructure was destroyed, including almost 1/3 of the area’s housing. Still, the Docklands saw a brief resurgence in the 1950s.

“London’s docks were unable to accommodate the larger vessels needed for modern container shipping, and the shipping industry moved to deep-water ports like Tilbury”

Then came the shipping containers.

Throughout the 1960s and 1970s, shipping companies came to rely on a standardised system of shipping containers, which could be loaded and unloaded at most major global ports. This new system relied on larger vessels, and fewer human labourers.

While containerisation made international shipping cheaper and more efficient, it was terrible for the Docklands. London’s docks were unable to accommodate the larger vessels needed for modern container shipping, and the shipping industry moved to deep-water ports like Tilbury.

Between 1961 and 1971, almost 83,000 jobs were lost in the Docklands. By 1980, all of London’s docks had finally closed, leaving behind about 8 square miles of derelict land in East London. Almost all housing in the area was council owned, and crime grew rapidly.

“Ward claimed not to have a master plan – “instead, we have gone for an organic, market-driven approach, responding pragmatically to each situation.”

In 1979, Prime Minister Margaret Thatcher came to power. She charged her Environment Secretary, Michael Heseltine, with addressing the decline of Britain’s post-industrial urban areas, including Docklands. Some members of her cabinet proposed to abandon the Docklands entirely.

Instead, Heseltine pursued a radically different approach. In 1981, he created the London Docklands Development Corporation, charged with spearheading a market-led revival of the Docklands. All local planning powers were handed to LDDC, despite protests from local councillors.

Planning decisions in the area would be made by LDDC. It received an initial grant of £80 million p/a, and in 1982, Heseltine created the Isle of Dogs Enterprise Zone, with no land tax, no planning restrictions, a 100% tax write-off on capital costs and a 10-year tax holiday.

The man in charge was Reg Ward, who was appointed CEO by Heseltine. The supremely pragmatic Ward claimed not to have a master plan – “instead, we have gone for an organic, market-driven approach, responding pragmatically to each situation.”

The first few years of LDDC were spent attracting investment for new riverside housing, bringing in small-scale industry (like Billingsgate Market in 1982), and opening up new office space. The proximity of Docklands to the City made it an attractive second site for businesses.

Derelict land was cleaned up and sold to developers, while the absence of local planning hurdles made the area attractive for private businesses looking to invest. By 1986, the LDDC had spent around £300m of public money, but had attracted £1.4 billion in private investment.

“DLR opened in 1987, under-budget and ahead of schedule, with subsequent expansions between 1991 and 1994”

In 1982, Ward commissioned the new Docklands Light Railway (DLR), which would make it easy to get from Docklands to central London. Running mostly on disused railway lines, DLR opened in 1987, under-budget and ahead of schedule, with subsequent expansions between 1991 and 1994.

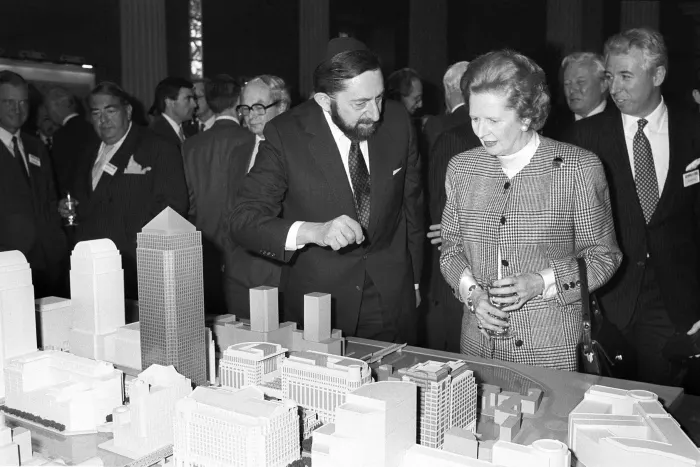
In 1983, Ward began pushing for an airport on one of the old quays, which would cater to business travellers looking to make short-haul flights between London and Europe. Operations at London City Airport would begin in 1987.

Ward’s greatest success came in 1985, when Ward met for lunch with American-Swiss financier Michael von Clemm. Von Clemm was interested in opening a restaurant in the area – but upon visiting, realised that Docklands would be a prime location for office space.

“Canary Wharf accounts for 67,000 finance sector jobs, putting it ahead of Frankfurt as a banking centre”

Ward worked with Von Clemm to draft a proposal for a new business district, taking advantage of the area’s lack of red tape. In 1988, the project was sold to Canadian developers Olympia & York, with the first buildings finished in 1991. This development is known as Canary Wharf.

Canary Wharf accounts for 67,000 finance sector jobs, putting it ahead of Frankfurt as a banking centre – and it’s no longer an office monoculture. Count in the hotels, shops and restaurants, and Canary Wharf employed around 120,000 people, pre-pandemic.

The LDDC began a staged withdrawal in 1994, and was formally wound up in 1998. Planning powers were handed back to local councils, and the area’s special tax incentives were gradually rolled back. But what Heseltine, Ward, and others had achieved was incredible.

Once-derelict Dockland had been revitalised, with attractive riverside housing, a shining new financial district, an airport, and a local transport system. For most of its history, LDDC managed to do this almost entirely by attracting private investment.

LDDC even managed to reverse a population slump in the area that had begun in the early 1900s, encouraging upwardly mobile ‘yuppies’ to take their first step on the property ladder in the attractive riverside communities of the Docklands.

“decline is not inevitable – with ambitious, pro-growth policies, we can achieve incredible things”

What can we learn from Docklands?

  • First, that decline is not inevitable – with ambitious, pro-growth policies, we can achieve incredible things.
  • Second, that areas perform best when govts allow their natural strengths to flourish – such as Docklands’ proximity to London.
  • Third, LDDC shows us the limits of localism. Local government figures, including Greater London Council Leader Ken Livingstone, hated Docklands. Critics said that LDDC was elitist and undemocratic – after all, it had the power to ignore local wishes entirely.

While the localism of the 1960s and 1970s had created poverty and decline, the efficiency and ambition of LDDC turned Docklands into one of Europe’s leading financial centres. Clean, modern, and full of potential. A sparkling sign of what is possible if we dare to dream.

Reproduced with kind permission of Sam Bidwell, Director of the Next Generation Centre at the Adam Smith Institute, Associate Fellow at the Henry Jackson Society, although views are his own.  Sam can be found on X/Twitter, on Substack, and can be contacted at s.bidwell.gb@gmail.com.  This article was originally published as a X/Twitter Thread at https://x.com/sam_bidwell/status/1815055102702498300?s=46

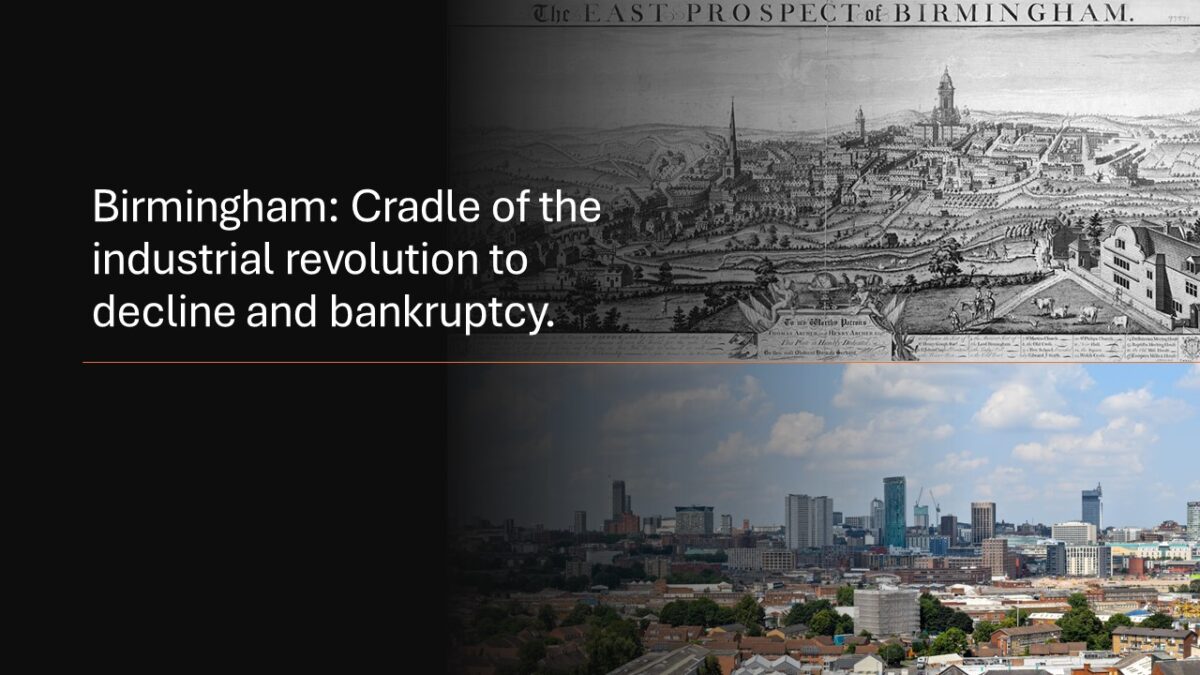
Birmingham: Cradle of the industrial revolution to decline and bankruptcy.

Birmingham used to be one of the world’s greatest cities. From 1954-64, service businesses around Birmingham grew faster than any other part of the country. In 1961, West Midlands households earned more on average than any other British region. This is how we ruined it…

“By 1900, Birmingham had more miles of canal than Venice. Between 1923 and 1937, the city’s population grew nearly twice as fast as the national average”

The West Midlands was one of the cradles of the Industrial Revolution. The region was the birthplace of the steam engine, while Birmingham itself was regarded as one of the world’s foremost cities. In 1890 it was described by Harper’s as “the Best-Governed City in the World”.  By 1900, Birmingham had more miles of canal than Venice. Between 1923 and 1937, the city’s population grew nearly twice as fast as the national average. The compact cavity magnetron, indispensable for radar, was invented there in 1940.

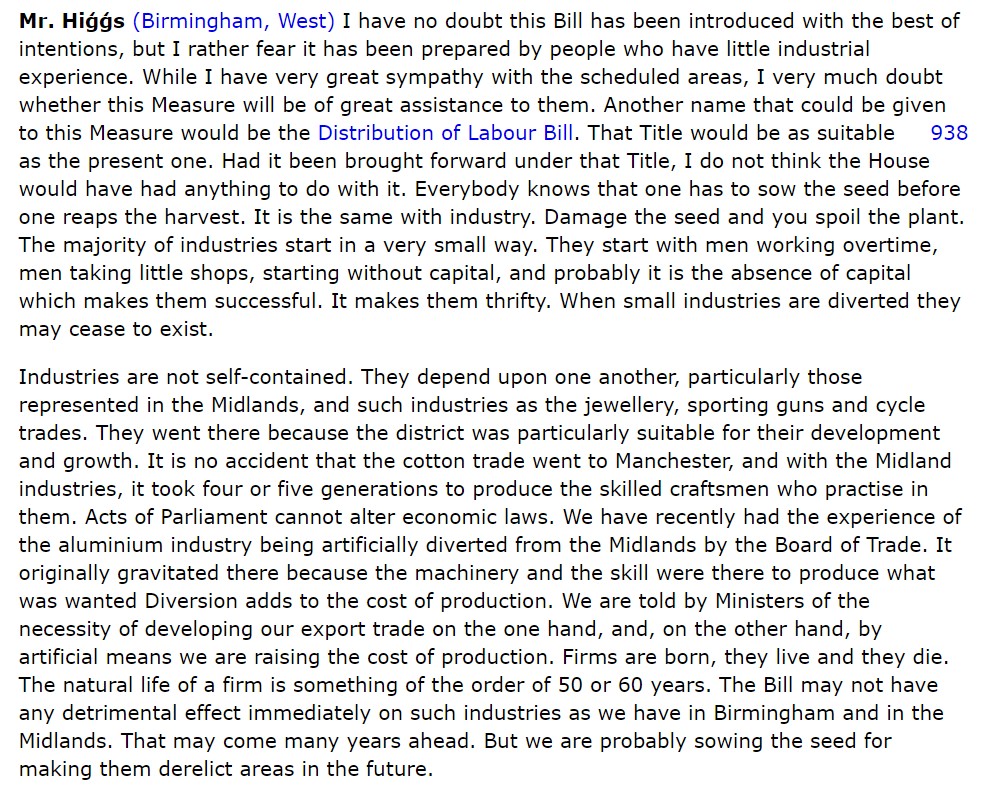
But Westminster viewed this growth as a threat to other regions. The Distribution of Industry Act 1945 sought to slow industrial growth in ‘congested’ areas like the Midlands, and push it towards declining industrial cities in Northern England, Wales, and Scotland.  The Act gave the Board of Trade veto power over planning applications for factories of a certain size, and created “development areas” in which the Government was charged with managing industrial estates. Walter Higgs MP, speaking during the debate:

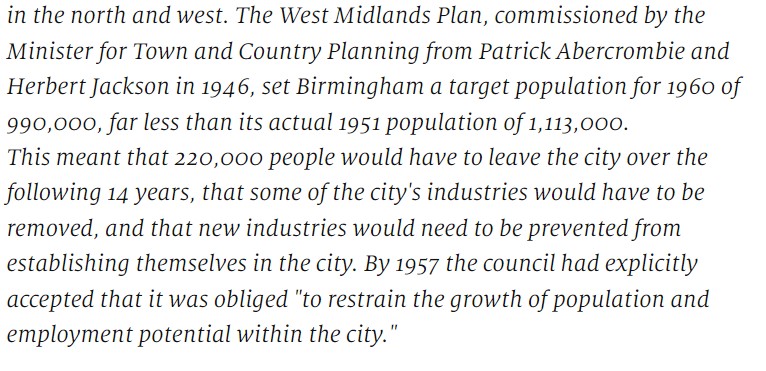
“local government was obliged to achieve a target population of 990,000, lower than its actual 1951 population of 1,113,000”

In 1946, the Government commissioned the West Midlands Plan, which attempted to constrain Birmingham’s growth – local government was obliged to achieve a target population of 990,000, lower than its actual 1951 population of 1,113,000.

The Government wanted Birmingham to shrink.

In 1947, the Town and Country Planning Act created Industrial Development Certificates (IDC). A company had to obtain an IDC if it wanted to expand an industrial plant beyond 5,000sq ft. This gave Government control over where industry could and could not be built.

“From 1951-61, Birmingham created more jobs than any city but London, with average unemployment less than 1%”

These restrictions constrained the city’s industrial growth – but despite these controls on heavy industry, there was relatively little regulation of service businesses. From 1951-61, Birmingham created more jobs than any city but London, with average unemployment less than 1%. 

“in 1964, the incoming Labour government declared Birmingham’s growth “threatening”

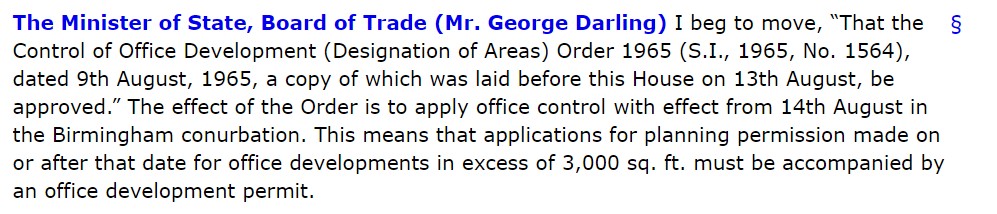
However, in 1964, the incoming Labour government declared Birmingham’s growth “threatening”. It restricted the development of new office space for almost two decades through the Control of Office Development (Designation of Areas) Order 1965.

And in 1975, plans for a West Midlands Green Belt were finalised, stifling the city’s housing growth. After decades of success, the Government had made it harder than ever to build new factories, new housing, and new offices in Birmingham.

The result? In the 1980s, Birmingham’s economy collapsed, with unprecedented levels of unemployment and outbreaks of social unrest. This wasn’t the result of neoliberalism – anti-growth regulation left the city vulnerable to global economic shocks.

“We have a tendency to describe fast-growing regions as “overheated” (see: modern London) – this is a dreadful instinct”

What can we learn from Birmingham?

1. We have a tendency to describe fast-growing regions as “overheated” (see: modern London) – this is a dreadful instinct. Where a local economy works, Government should enable it to flourish, rather than seeking to spread that growth thinly.

2. Britain’s regional inequality is a product of regulation, not big business. Without the above regulations, Birmingham would likely still be a thriving second city. If we want to “level up” the rest of the country, we should liberalise planning and provide cheap energy.

3. Industrial strategies don’t work. For every good example of industrial strategy, there are five examples of expensive failure. Instead of trying to direct growth, Government should be aiming to create conditions in which growth can occur naturally.

Reproduced with kind permission of Sam Bidwell, Director of the Next Generation Centre at the Adam Smith Institute, Associate Fellow at the Henry Jackson Society, although views are his own.  Sam can be found on X/Twitter, on Substack, and can be contacted at s.bidwell.gb@gmail.com.  This article was originally published as a X/Twitter Thread at https://x.com/sam_bidwell/status/1812177506822144055.

Main images includes a ‘View across Birmingham’.  Source Smileyface on 20 July 2021, at https://www.flickr.com/photos/whataloadofmoo/51323892597/.

Monetary Policy and Environmental Progress

Why Bad Money Drives Up Pollution

By Josh L. Ascough

“actions towards the green economy are for nought; not just while the tragedy of the commons and eminent domain remain, but while monetary policy remains in favour of secular inflation”

Many people are growing concerned about pollution and its growing effects on our environment and quality of life. So much so it seems, that politicians are now taking nuclear power much more seriously than previously.

We’ve seen a greater push towards solar and wind power, as alternative and more renewable means of providing energy for national and global economies.

Despite this, actions towards the green economy are for nought; not just while the tragedy of the commons and eminent domain remain, but while monetary policy remains in favour of secular inflation.

Secular inflation is a term used to describe a state of affairs, where the policy of the monetary authorities; in the UK’s case the Bank of England, is to have a prolonged or gradual increase in prices via inflation targeting. The current target of the Bank of England sits at 2%, so the BoE aims to increase the money supply (MS) over the quantity demanded (MD) during each period to meet their price index targets of an increase by 2%.

This excess expansion of MS, leads to a decrease in the purchasing power of the pound, meaning that money is not as valuable as it was in the previous period, nor is it as valuable as that of the base year. The base year, also known as year 1, is the starting point for measuring changes in the price level and purchasing power of money. It is derived as being equal to 1.00. If the purchasing power of the pound decreases by 50%, then the price index in year 2 will be marked as 1.50; similarly if the purchasing power increases by 50% it is marked as 0.50. (For more simple calculations shown later below, a comparison will be made between the price index of 2021 to 2020, rather than the base year).

From a secular inflation perspective, the value of money for one year holds an “expiration date” in the next year.

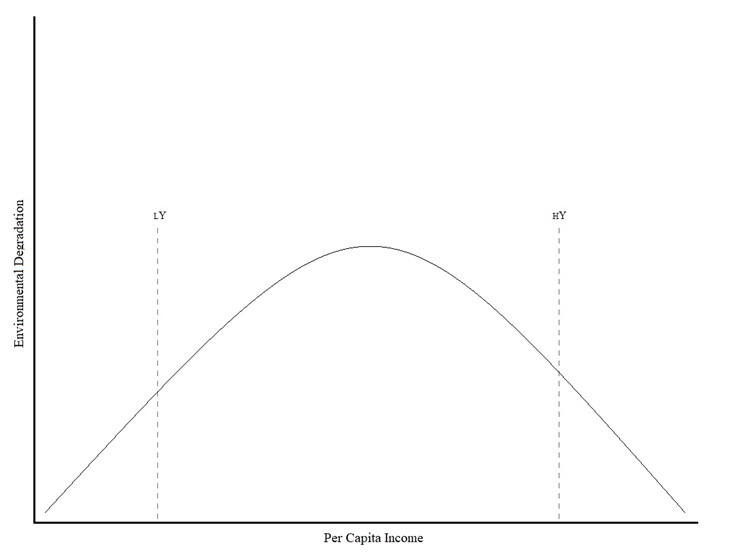
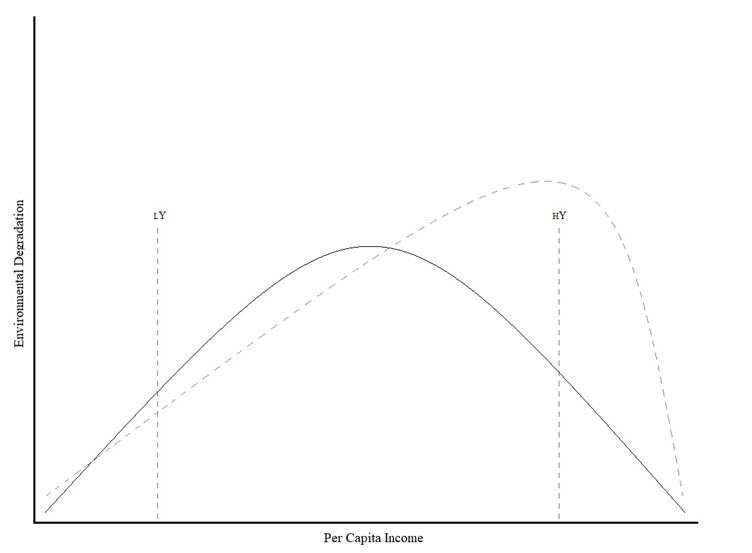
This policy effect on environmental quality and progress can be examined using the Kurznets Curve.

The Kurznets Curve measures environmental quality by per capita income.

“as we become richer, we place a higher value on the environment and are more able to maintain it”

The curve shows that as economies begin to develop, environmental quality worsens, because new activities are being enacted which impact the environment, but there is not enough monetary productivity to incentivise the maintenance of the environment. As per capita income increases, the cost of maintenance or seeking renewable alternatives, in proportion to income allows for a cleaner environment becomes a desired activity; as we become richer, we place a higher value on the environment and are more able to maintain it. This is shown by the location of low income; denominated as LYand HY in relation to their relationship to the x and y axis.

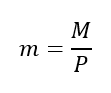
The problem is that the Kurznets Curve measures nominal income, rather than real income. Nominal income refers to the total quantity of current money (10 £50 notes = £500), whereas real income refers to the actual purchasing power of that £500. This real money balance is calculated as:

Where m is the real money balance, M is the nominal and P is the price index.

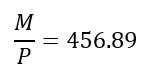
The current CPI 9.1, so the real value of the £500 is, so by comparing the price index of June 2021 (111.3), to June 2022 (121.8)

Meaning £500 M (nominal) from 2021 is worth £456.89 (£457 rounded) in m (real) in 2022.

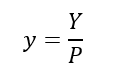
We can also calculate the real level of income by denoting y as real income, and by dividing Y (the nominal level of income) by the price index P:

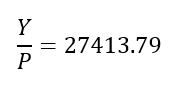
Suppose average per capita income is £30,000. According to the curve measuring nominal income, a per capita income of £30,000 should see us shifting to the right of the curve. However, adjusting to the real level of income via P we obtain:

This means that Y £30,000 level of income from 2021, is worth y £27413.79 (27414 rounded) level of income in 2022.

The trend of reduced real value can be shown further. Treating 2008 as the base year and looking towards the receding purchasing power of the pound, it can be observed how the pound has reduced in value over time:

This means that Y £30,000 level of income from 2021, is worth y £27413.79 (27414 rounded) level of income in 2022.

The trend of reduced real value can be shown further. Treating 2008 as the base year and looking towards the receding purchasing power of the pound, it can be observed how the pound has reduced in value over time:

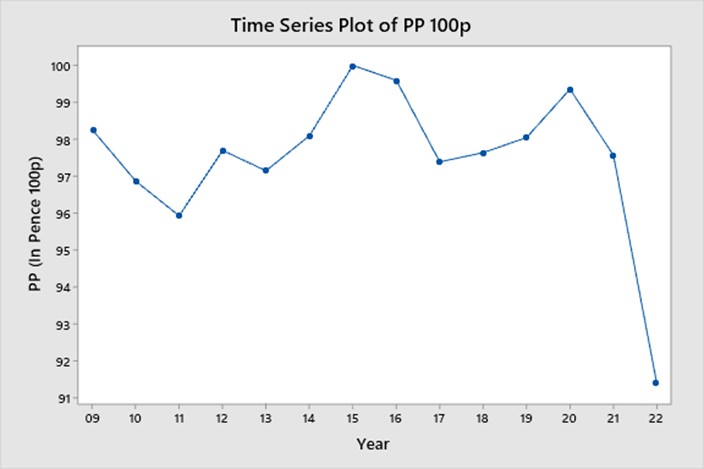
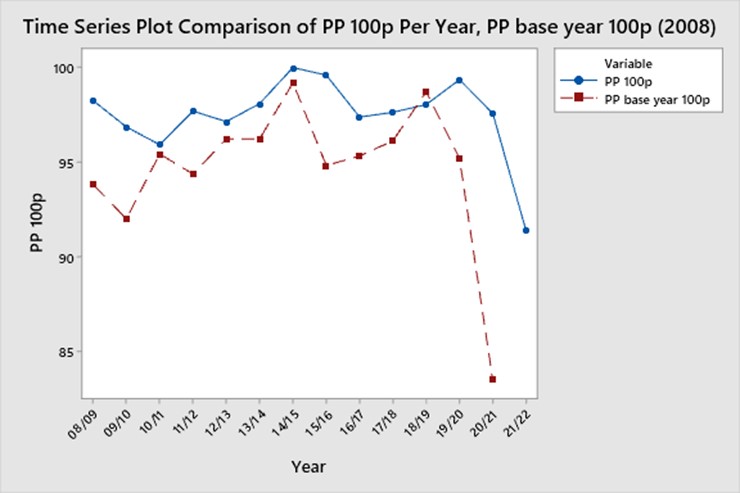
Above we see a time plot of the real value of the pound from the period 2008 to 2022. The plot starts at the base year and looks at the value of the pound (measured in pence) for each year in comparison to the previous year. For example a nominal money balance of 100p in 2013 is worth 97.15 in real money balance terms, compared to nominal 100p in 2014, which is worth 98.10 in real balance terms.

We can also observe the contraction in real money balances as a comparison to the base year and further compare it to the year by year data:

In the graph the blue line represents the real value (m) of 100p on a year by year comparison (the real value of 100p in 2009 compared to the real value of 100p in 2010 etc), whereas the red line represents the onwards reduction in the real value of 100p compared to the previous years real value, from the point of the base year.

To give an example of this, in the period 08/09, the real value of 100p compared to the base year was 93.84, whereas in 09/10, the real value of that 93.84 in the next year was 92.02.

“The largest fall in real value occurred after the financial costs of the covid lockdown, where the real value of £30,000 in 2022 is £27,413.79”

A similar phenomenon can be observed with regards to wages. Supposing the median nominal income is £30,000, we can see the change in the real value of the median income over the period from 2008 to 2022:

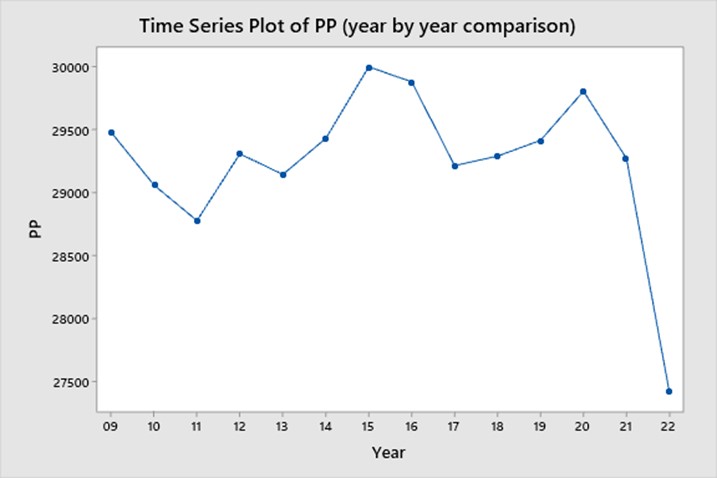
Here we see the real value of income from 2009 to 2022, where 2008 is treated as the base year. During the aftermath of the 2008 financial crises, we see the real value of £30,000 drop from £29,480.97 in 2009 to £28,778.14 in 2011. The largest fall in real value occurred after the financial costs of the covid lockdown, where the real value of £30,000 in 2022 is £27,413.79.

Translated back to the Kurznets Curve then, it can show the following:

By adjusting nominal to real, we see that the slope of the curve rises and overall shifts further to the right. Meaning that adjusted to real money balances, renewal of the environment becomes a lot less affordable for the average person. As time moves on with a policy of secular inflation in place, the value of the £30,000 wage decreases, and people need to acquire higher nominal balances each year in order to reach previous levels of real income; ad infinitum.

This means that we are always a step behind (or according to the CPI, 9.1 steps behind) when it comes to environmental quality. This leads to one of the many costs of inflation; protection.

When people expect inflation to rise or to be constant, they spend resources to protect the value of their assets from the effects of inflation. This is in the form of personal finances, investing in precious metals such as gold or silver, or seeking advice from accountants.

While this type of activity is rational to the person(s) looking to protect themselves, it is also wasteful compared to the value that could’ve been satisfied had there been no inflation to begin with. This further adds to slowing down the process of per capita incomes moving to the right of the curve, because the loss of purchasing power for financial capital, diverts resources to “wasteful” endeavours.

Our current policy of price stability by injecting excess money into the economy, as an attempt to avoid deflating prices, provides us with the very effects that slow the Kurznets Curves process; a rise in output prices which detract from falls in unit production costs.

If we want to take environmental degradation, and improving the environments quality seriously, then it is important to address secular inflation and abandoning the policy of inflation targeting, in favour of a productivity norm to allow for growth deflation, financial stability and a reduction in unit production costs to spur on reduced output costs.

Sources:

Fuel Shortages ≠ Inflation

Inflation Is Here, But There’s Also A Shortage Game In Town

By Josh L. Ascough

In almost all mainstream economics textbooks, when the subject of inflation is reached, the standard definition is that inflation is a general increase in the price level. This definition has sparked numerous conflations of the cause and effects of oil and gas prices and inflation during the financial aftermath of Covid restrictions, policies and the current conflict between Ukraine and Russia; Investopedia recently attempted to provide a clear answer to the correlation of inflation and the resulting high oil prices caused by the shortage by stating “Higher oil prices contribute to inflation directly […] by increasing the cost of inputs.”

“this definition of inflation is facetious at best and leads to bad policies at worst. The general increase in the price level definition, defines inflation by its symptom; or effect, rather than defining it by the cause”

But the fact of the matter is this definition of inflation is facetious at best and leads to bad policies at worst. The general increase in the price level definition, defines inflation by its symptom; or effect, rather than defining it by the cause. Nicolas Cachanosky, an Assistant Economics Professor at Metropolitan State University, sums this confusion up stating that:

if there is more than one reason why the price level may change, then defining inflation by describing a movement of a variable that can have multiple reasons invites confusion. This confusion can eventually lead to errors in monetary policy. More accurate would be to define inflation by its cause rather than its effect.” (Cachanosky, 2020, p. 33 emphasis in original).

A general increase in the price level can occur outside of the means of inflation. If an economic resource; which is demanded in multiple lines of production and multiple production periods faces a shortage, this will create a general increase in the price level. The same effect will be seen if demand for this multi-specific good arises. Excess demand, supply shortages and inflation may hold similar effects but they do not hold the same cause.

“inflation must be defined by its cause rather than its effect. Inflation is the occurrence of an excess increase in the money supply over the demand for money”

In order to better combat the confusion, inflation must be defined by its cause rather than its effect. Inflation is the occurrence of an excess increase in the money supply over the demand for money:

MS > MD

It is not simply an increase in the supply of money full stop; money must have an excess (surplus) over the quantity demanded in order to classify it as inflationary; just as a monetary deflation cannot be classified as a general fall in price: a monetary deflation requires that:

MD > MS.

The Cambridge and Fisher equations respectfully provide a clear picture of the variables required, both however measure separate aspects of the money equation; the Cambridge equation focusses on the demand for money (MD) and the Fisher equation looks at the money supply (MS). the MS equation; adjusted to measure real output, is calculated as:

MS × Vy = Py × Y

Where Vy and Py are the money velocity and price levels related to all real output transactions. On the other side is the Fisher equation which is calculated as:

MD = k × (PyY)

Where k is capital and PyY is the nominal income held by economic actors. If the price level fluctuates up (down), then MD rises (falls) in addition as a result to maintain a constant monetary balance. In other words the demand for money is the demand to hold money balances which can be liquidated easily at later periods.

If MS = MD then it follows that Vy = . This shows that MV is an inverse of MD. A higher (lower) MD entails a higher (lower) k; therefore a lower (higher) Vy.

To reiterate, the cause of inflation is not MS in period 1 is greater than in period 2, but that ∹ MS > MD = inflation.

The effects of inflation on the price level are equally not as simple. Since excess money supply enters the economy from a specific point, inflation seldom effects all prices at the same rates, nor during the same time setting, as economic actors plans may hold earlier or later time structures of implementation. It is unsound to assume that the percentage increase of all prices would hold the same rate, as the rate of each price increase will vary depending on a variety of factors. We can hypothesise a median or mean rate, but this would not suggest a single rate, as it would be subject to deviations in relative price increases.

“This lack of in-house sourcing, whether one is in favour of the measure as a counter to climate change or not, is a key source of the current high price fluctuation in oil and gas”

While the current effects of inflation are nothing to shrug at, it does not mean all the woes are inflation related. The current fuel crises is a supply shortage caused by the conflict between Ukraine and Russia. Many Western governments have taken the position to not import Russian oil while the conflict is ensuing, whilst also not pursuing in-house sourcing in order to mitigate the price fluctuations. This lack of in-house sourcing, whether one is in favour of the measure as a counter to climate change or not, is a key source of the current high price fluctuation in oil and gas.

This is not to say the price level should not be permitted to adjust and must remain constant. Assuming monetary equilibrium to be desirable, changes in productivity which generate fluctuations in prices should not be obstructed by restrictive monetary policy, as this would destabilise monetary equilibrium (Monetary Equilibrium is a state of affairs where the quantity of money supplied is equal to the quantity of money demanded).

In a case where productivity increases (decreases) would generate an increase (decline) in supply, a fall (rise) in prices would be an appropriate movement; attempts to halt such movements would cause distortions in the market process. This is what is referred to as the productivity norm and is formulated as:

MV = P↓ Q↑

Where M is the stock of money, V is the velocity, P is the price level and Q is the quantity of goods and services.

It could be argued that price fluctuations caused by a supply shortage can contribute to the effects of inflation, and that the distinction between cause and effect is a game of semantics, but the distinction is a very real and important one in order to enact a sound monetary policy, and to ensure economic actors are better informed to make microeconomic solutions; as the late Professor Steve Horwitz put it:

“While there are Macroeconomic problems, there are only Microeconomic solutions.”

In short, supply shortages cannot contribute to inflation as, unless policy makers respond to a shortage with a monetary stimulus; further adding to an excess money supply, the shortage itself contributes nothing to MS > MD; it can add salt to the painful effects of the wound, but not contribute to the wound itself.


Continue reading “Fuel Shortages ≠ Inflation”