Mike Swadling of this parish is Vice Chair of Governors at Winterbourne Nursery and Infant School in Thornton Heath, Croydon. Many of us have found lockdown hard, too many of us have failed to put the time to good use, but one local school has used this period to good effect.
“Founded in 1906, Winterbourne Nursery and Infants School sits on a site with separate Junior Boys and Girls schools. The last remaining single-sex, state-funded junior schools in the country. Whilst the schools often cooperate they remain very much independent schools, with their own staff, heads, budgets and governors”
“ensure compliance with required regulations and the good governance of public resources. Following much hard work over the previous year the school received a commendable ‘Substantial Assurance’ audit”
“Teachers provide a warm, nurturing start to each day with a live online session. They give clear guidance and support to pupils and parents about the day’s learning tasks.”
“This past year has been a challenge for everyone, some of us have used the time to set goals, many of us have failed to achieve them, but one local school, Winterbourne Nursery and Infants, can rightly say, its whole community should be proud of its journey of self-improvement”
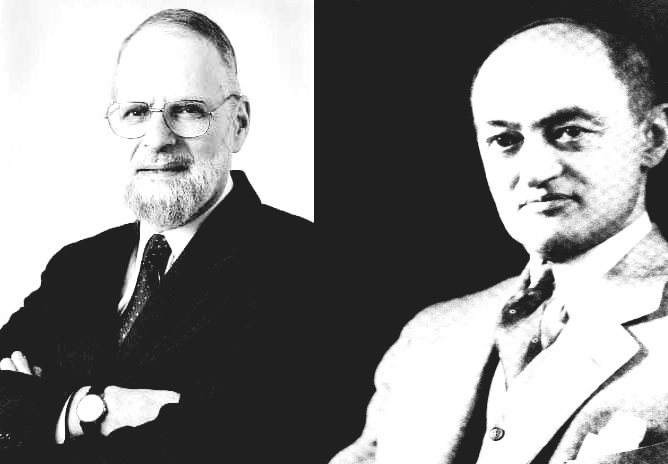
There is a fierce differentiation between Professor Israel Kirzner’s entrepreneur and his role, and that of the late Joseph Schumpeter’s entrepreneur and the role he plays in the market.
For those who are unaware, the entrepreneur, as according to Professor Kirzner, is an equilibrating force who, through discovery, perceives unseen opportunities for pure profit due to imperfect knowledge of market participants; under the market process and the state of disequilibrium, he moves the market closer to a state of equilibrium. The late Schumpeter had, as would appear on the surface, the complete opposite view of the entrepreneur. To Schumpeter, the state of equilibrium is a set routine; an even state of circular flow, and the entrepreneur, for Schumpeter, breaks away from convention; he is a disruptive force, who breaks away from the set and known; to destroy existing structures, creating a new state of disequilibrium by dislodging it from the state of equilibrium.
At a first glance these two concepts can easily be seen as separate theories of entrepreneurship; and they are. However, both theories can also be looked at as being the same, but under a different lens of perspective; one expanding to see a wider view, another contracting to focus on a singular area of interest.
This is what I hope to share with the reader; an idea that Kirzner’s and Schumpeter’s entrepreneurial actor and process can be seen as merely being witnessed from differing angles of the same lens and can, in theory, be woven together.
It should be noted I will be referencing Professor Kirzner’s work; Competition and Entrepreneurship, solely for this. Due to Schumpeter’s passing before Kirzner’s work on entrepreneurship began, we cannot know of his views of Kirzner’s work, or what his perception of Professor Kirzner’s entrepreneur would have been. In such case, I shall refer to Kirzner’s work to give insight into the perceived theoretical difference between the two concepts of the entrepreneur.
If we look into Professor Kirzner’s writings on the monopolist, he speaks of how, if a perceived monopolist holds his position due to a claim of ownership over a particular resource required for production, from a short-run view he would appear to be a monopolist. However, if our view is not focussed on a particular period, and is instead expanded to before he acquired the resource and it is that of a long-run view, if his acquiring was due to other profit seekers not knowing of the profit opportunities of this resource, due to a state of disequilibrium, then he is an entrepreneur who; through discovery, saw an absence of information and a missed opportunity for pure profit.
Taking this understanding into mind, if we return to the two arguments from Krizner and Schumpeter on the topic of the entrepreneur, we can theorize that the two are true, but merely being viewed through the same lens at a short-run, contracted view, and a long-run, expanded view of the entrepreneurial process and market state of equilibrium and disequilibrium.
What is meant by this? Let us go into a bit of investigation.
According to Schumpeter’s view of the entrepreneur, when the market is in states of equilibrium; producers produce the same quantities of goods and services as that of previous periods, the entrepreneur detracts from this convention and breaks away into a new route of market activity; distorting existing structures and moving the system into uneven states of disequilibrium. This, according to Schumpeter, is the creative destruction of the market economy, and the market process.
If we contract our lens to view the perception of the market actors prior to the entrepreneur’s activities, then we can see how, to the understanding of what is known to said actors, they were in a state of equilibrium and the “pest” known as the entrepreneur, had unravelled what they perceived to know as being all information available. We are now looking at the economic process prior to the entrepreneur’s arrival, within a short-run period.
As explained earlier, according to Professor Kirzner’s view of the entrepreneur, at any given time, the market is paved with ignorance of the individual economic actors, with missed, unknown opportunities, and that the market is in these states of disequilibrium, due to no actor having perfect knowledge; no economic actors are omniscient. The entrepreneur, as an outside observer, sees these missed unperceived pieces of information of resources to which could have more profitable uses, consumer desires not being met, and want/needs unknown to consumers to which they had no prior understanding for their satisfaction; he prepares forward looking, multi-period plans in order to achieve pure entrepreneurial profit. It is this outcome, if successfully perceived, which brings market activity via a process, closer to a state of equilibrium.
If we now expand our lens to ex-post the entrepreneurial actor’s seeking of the opportunity for pure profit, we see; through our expanded lens, that there were unnoticed, unknown opportunities for profitable market activity, to which the producers prior faced an absence of information (they don’t know what they don’t know), or, they faced optimal ignorance (they know what it is they don’t know, but it is more costly than beneficial, and so efficient to be ignorant).
While Kirzner and Schumpeter did have different theories around the subject of the entrepreneur; there is no doubt to be had, if we take Professor Kirzner’s short-run and long-run argument of examining the monopolist; with regards to looking at the matter from a shorter or longer period, it becomes possible to see why a state of equilibrium was perceived by the economic actors with regards to their known information ex-ante the entrepreneurs arrival.
This short piece should not be seen as a criticism of either Professor Kirzner’s or Schumpeter’s work; on the contrary, it is an attempt to explain that the two theories can be examined to be perspectives of differing periods of time, from the perspective of the economic actors of said differing times; the ex-ante and ex-post of the entrepreneur.
This is purely designed to be a short piece on the matter; if further examination is desired, you may find it in the following books:
Competition and Entrepreneurship – Israel Kirzner
Discovery, Capitalism, and Distributive Justice – Israel Kirzner
Essays on Capital and Interest – Israel Kirzner
Theory of Economic Development – Joseph Schumpeter
Capitalism, Socialism and Democracy – Joseph Schumpeter
At the beginning of March, Rishi Sunak; Chancellor of the Exchequer, announced the first budget since the pandemic was declared.
As part of the budget and this “recovery” plan, two specific changes to taxes were announced: Corporation Tax is set to rise on large companies from 19% to 25%, and a freeze on Income Tax thresholds; bringing roughly 1 million more people into paying Income Tax, and a million more into paying at the higher rate.
The Institute for Fiscal Studies reported it is set to raise an extra £29 billion by 2025-26.
But this is fallacious at best and bad economics at worst.
One thing to note of before continuing; which will help in explaining the problems with these hikes, is that Governments’ don’t control taxes, they control tax rates. Taxes are what happen when you combine tax rates with economic behaviour. In addition corporations don’t “pay” taxes, they collect taxes; taxes to a corporation are simply an additional cost, and an increase to costs will create differing economic behaviour.
With these in mind it should become obvious at merely a glace that the tax hikes are not going to have the perceived effects the Chancellor thinks they will.
Let us address these in separate sections; from the simplest to most complex, starting with the new Income Tax thresholds.
“Most jobs paying these rates are part-time or sales assistant retail work, therefore it will have a negative financial effect on these demographics; such as single parents looking to work part time and students. Further, this will cause a hit to high-street businesses struggling to find employees”
Freezing the Income Tax thresholds will force those earning £12,500 and below to start paying Income Tax. This will inevitably lead to low income individuals to see their living standards drop further, due to the forced decrease in expendable income, many will find it more difficult to satisfy their wants/needs and see their marginal utility of goods drop. As a result a few things will happen:
More people with no work experience or qualifications will remain and enter the benefit trap, since the credits and additional welfare assistances will be not necessarily more appealing, but more manageable for meeting expenses than the large cost to incomes, due to welfare acting as a substitute to income, rather than a supplement, which means the government will not be getting as many additional receipts as they imagine.
Due to those earning £12,500 or lower paying Income Tax, spending by those demographics will see a decrease, which means there will be less revenue generated via the Sales Tax, and this decrease in consumption could further hurt small businesses already on the margin.
There will be a further disincentive to work in these positions. Most jobs paying these rates are part-time or sales assistant retail work, therefore it will have a negative financial effect on these demographics; such as single parents looking to work part time and students. Further, this will cause a hit to high-street businesses struggling to find employees, and as mentioned above, will mean the government will not get as many additional receipts as they imagine.
There will be mounted pressure to raise the minimum wage in an attempt to counteract the introduced taxes. If this occurred those unable to produce at the new rates, would find themselves laid off and unemployed; essentially making it impossible for them to find employment; increasing the unemployment rate, and, once again, decreasing the degree of receipts the government is expecting to gain.
But that is just the lower income thresholds, as mentioned above millions are expected to be pushed into the higher Income Tax rate of 40%. What can we expect the results of this will be?
Similar as mentioned above, the push up to a higher tax threshold will mean those previously paying 20% will find due to the decrease in expendable income that their living standards will decline do being able to satisfy less needs/wants, and will find their marginal utility of goods and services decrease.
I’ve gone over this a few times in previous pieces but to reiterate, let’s illustrate what is meant.
If we look at the Mangerian representation of marginal utility we get a much clearer picture of this:
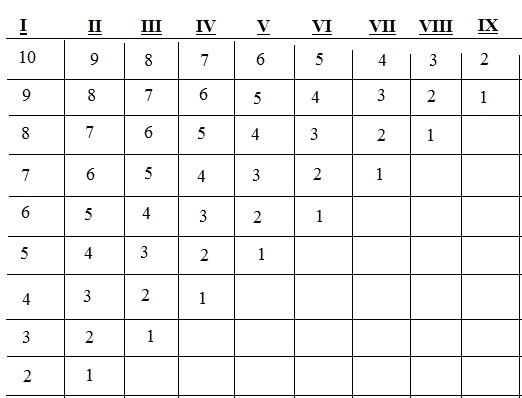
Suppose ‘A’ has an annual income of £30,000; after a progressive income tax of 20%, ‘A’ is left with £24,000. Additionally suppose ‘A’ has 9 needs/wants in order of importance for satisfaction. These are:
Food.
Bills.
Clothing.
Travel.
Owning a Pet.
Pet Food.
Leisure.
Saving.
Holidays.
Suppose ‘A’ is only able to satisfy six of these needs/wants. Because marginal utility is based on the level of satisfaction = utility, and the lowest want = marginal, ‘A’ would do without the 9th, 8th, and 7th. Under the pushed up threshold of 40%, ‘A’ would be left with £18,000, and would have to do without the 6th, 5th, and 4th.
Now these needs/wants illustrated are not determined and can be interchanged with each other or different goods and services based the subjective values of the individual, but it still stands that the new threshold will force median earners to restrict themselves further.
This in turn has a negative feedback to the industries which provide those goods and services done without. Those industries, to which consumers pushed into higher tax thresholds have done without, will in due course see a drop in sales; not just meaning they are making fewer or no profits, but are not covering their costs, which will in turn cause further unemployment, closing of shops in locations hit hardest, and possibly lead to bad deflation; the kind of deflation which occurs due to economic downturns in production and productivity.
There are also the effects on savings and investment.
If people are leaving consumption needs/wants unsatisfied in order to satisfy those needs/wants that hold a higher marginal value, then we can expect those median earners to reduce the amount they are saving; since current consumption is more intense than ability and/or desire to save for future consumption, once pushed into an Income Tax threshold of 40%
In such an instance MV (money velocity) would be at a high, indicating people’s time preference for current consumption. This would mean the banks would not be able to lend as much, and the interest rate would have to rise; signalling to businesses and entrepreneurs that now is a bad time to expand their capital goods or bring new markets to consumers.
This would mean fewer businesses will be able to diversify themselves through expansion, leading to a slower growth in production and job creation.
“Does it sound like a bad budget? …The Corporate Tax is scheduled to rise from 19% to 25%, making it the highest rate of Corporate Tax since 1982 when the rate was roughly 30%”
Does it sound like a bad budget? Well we haven’t even gotten into the Corporate Tax and things are about to get a lot worse with even more negative feedbacks.
The Corporate Tax is scheduled to rise from 19% to 25%, making it the highest rate of Corporate Tax since 1982 when the rate was roughly 30%.
This will have a variety of negative effects, depending on how businesses respond to the rise in corporate tax; a combination of behaviours could be expected, considering the harm to which the economy has been subject to due to the lockdown and other government policies.
While the budget states that it is only large corporations that will see their tax rate increase, it is still to have a negative effect on small businesses; but we’ll get to that as we go along.
As stated earlier, not only are taxes what happen when combining tax rates with economic behaviour, but corporations don’t “pay” taxes, they collect them. What should be heard when “we’re raising taxes on corporations” is uttered, is:
“We’re going to use corporations as a funnel for higher rates of collection”.
With this in mind what behaviours are to be expected from the funnelling of taxes via corporations?
Let’s talk about consumer prices first, because this links closest to what was mentioned with regards to Income Tax.
One way economic behaviour can respond to an additional cost is to see an increase in consumer prices. This would mean alongside the new Income Tax thresholds, many consumers will find their cost of living rising sharply, and have to readjust their optimal ranking of goods and services they hold a utility for, to which would mean there would be additional needs/wants left unsatisfied.
This, similar to what was stated earlier, would mean businesses would not see as high profits as the government is counting on, and government receipts via the Corporate Tax would see a decrease, because people are seldom able or willing to spend as much.
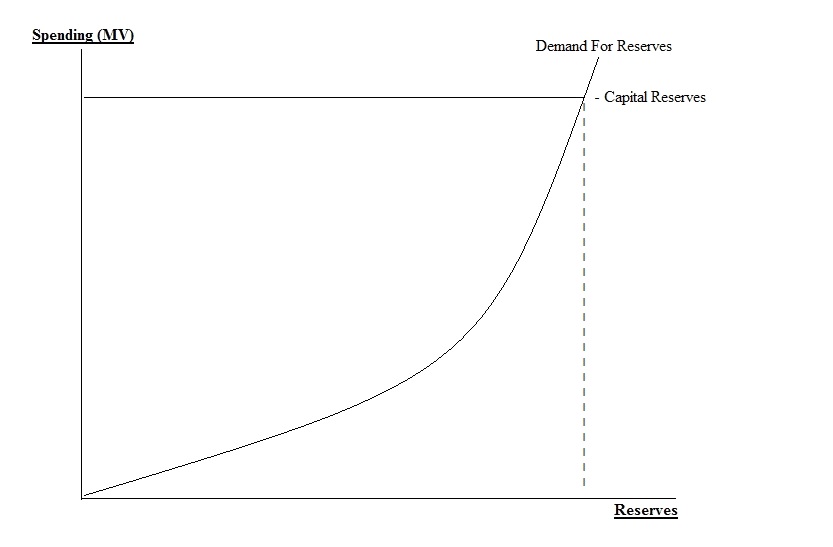
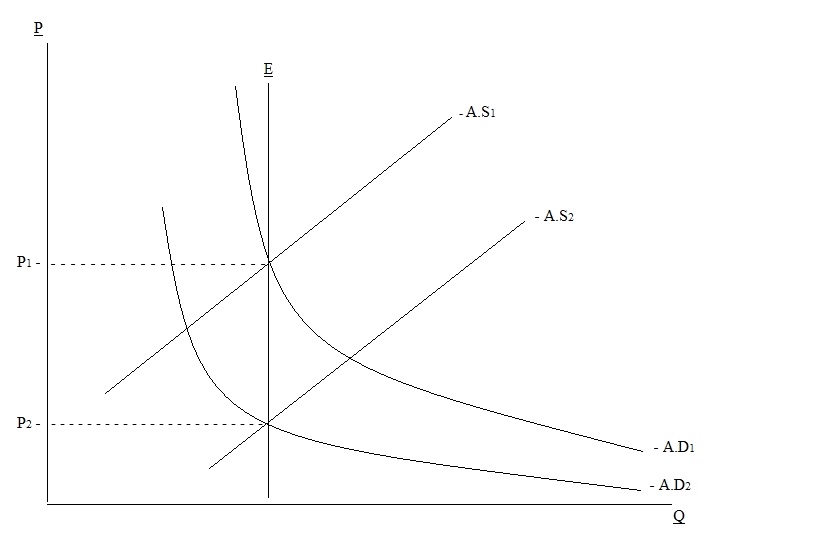
This large reduction in spending, alongside a possible withholding from investment into expansion, is what could lead to the bad kind of deflation. A basic outline can be seen below.
In the illustration shown above we see a basic example of a fall in spending. Aggregate Demand (A.D1) shifts downwards to the curve of A.D2. This causes output to fall also, as displayed by Aggregate Supply (A.S1) shifting downwards to A.S2. This leads to the price of goods in turn falling from P1 to P2.
It must be stressed that to class this fall as a good thing would be in the negative. Remember, these falls in prices and demand aren’t because an optimal quantity of goods have satisfied consumer wants/needs for the complete period in which they wish to utilise them; it is because overall spending has fallen, and because output has shrunk. Which means there are expansions of capital goods that have been abandoned, and in order to offset the cost, wages have to be cut, workers laid off and prices have to fall.
It is a somewhat similar story with regards to other behaviours that can be an outcome of the tax hikes.
A rise in tax rates on profits would mean in order to offset the additional cost, wages could see a decline. This brings us back to what was mentioned earlier about lower expendable income in a cycle:
Income Tax Rate Rises – Less Expendable Income – People Spend Less – Corporate Tax Rate Rises – Wages Fall/Prices Rise – Cost of Living Rises – People Spend Less – Cost to Businesses Rise/Revenue Falls – Outputs/Wages Fall.
Leading to, as mentioned before, the government finding its receipts are not as plentiful as they anticipated; fewer receipts via the Sales Tax, Corporate Tax, and, if workers are laid off, Income Tax.
Another Area to talk about is the process of production and entrepreneurship.
Capital and production are forward-looking, multi-period processes. The process of production is not a simple, pre-determined static motion; entrepreneurial producers set plans in motion during set periods and can have these changed, moved forward as they originally anticipated, or at worst abandoned at the difference stages of completion.
To go into more detail, let us suppose the following:
Suppose I hold a claim to wheat seeds. I wish to plant the seeds and grow wheat in order to make bread, so I search to purchase land that is suitable for my purposes. I find a landowner and agree to pay him with a portion of the funds I receive from selling the wheat, plus interest.
After time has passed and the wheat is fully grown, the first period of my plan is complete. I discover there is a high demand for vodka, and so must make the choice whether to continue with the production of bread, produce vodka, or sell my wheat to those who produce vodka. I finally decide on the selling of the raw wheat itself.
After selling my wheat to bread makers and vodka producers, I pay the land owner and must make the following decision:
Do I continue to pay him for the use of this land; or, with my revenue, do I buy the land outright, and rent it to producers looking to produce wheat for bread and vodka, knowing that this is an industry in high demand. Or, alternatively, do I buy the land outright, and continue to produce wheat for high demand industries without needing to pay rent?
Ultimately I decide to buy the land outright; initially to produce wheat for bread and vodka. However, I see consumers are favouring a competitor for bread, and demand for vodka is not being met due to most wheat producers selling to this bread maker for possible higher returns. Finally I decide to dedicate my wheat production to the manufacturing of vodka alone; specialising in one particular area of the market.
The point of this long winded story, is to illustrate that at any time, initially perceived long-run plans for the market can change. That the market process is not an indefinite, unchanging plan, but that the plans producers make are multiple; in varying periods of production and can change from initial desired outcomes.
Because the process of production is a long-run, multi-period one, added externally imposed costs do not merely effect the outputs by seeing a smaller scale of outputs, they can and will effect different periods of production; which can in turn, effect the employment of those in the production of goods of higher order. The market is interdependent, and so negative shocks to one period of the process can and will send negative feedback to earlier stages of production.
I gave mention earlier to how the rise in Corporate Tax rates would have an effect on small businesses and not just larger businesses; this, like most of what we’ve talked about here, would be a knock on effect.
How so?
Small businesses unlike larger, more international businesses don’t have the ability to branch out; nor large stocks of capital to diversify themselves and rely on other companies to provide products for them to line the shelves with. Small businesses don’t have the means to produce output, nor do they have large quantities of capital goods to utilise input materials should a supply run short. If the higher rate of Corporate Tax causes a reduction in outputs, or, at the least, a slower expansion of production, then small businesses; particularly small, family owned retail shops, will find the already produced, output stock they can store for sale will be heavily reduced or have a higher cost.
A higher Corporate Tax rate may not hurt small businesses directly, but it hurts them indirectly by reducing the amount of outsourced goods they can afford; requiring them to lower their stock or increase their prices, making them more at risk of shutting down.
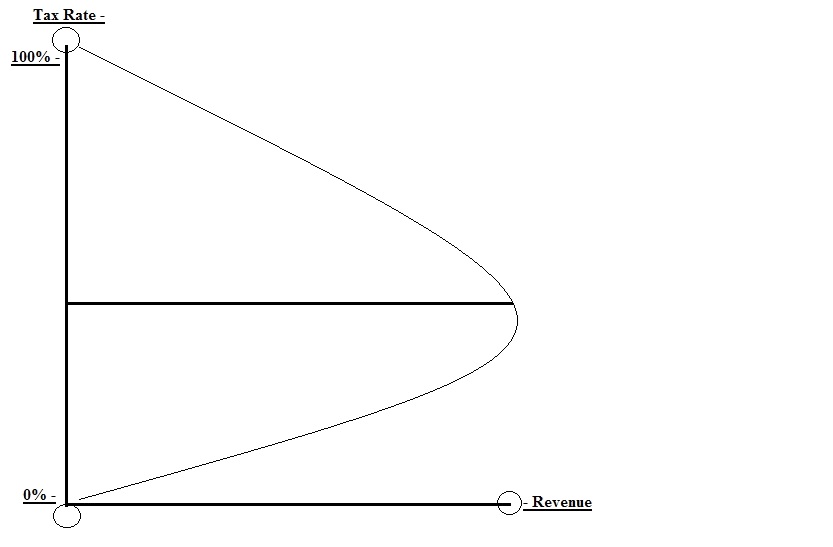
“The Laffer Curve theorises that there are two peak points of a tax rate, at which the government would receive 0 revenue. At the top is a 100% tax rate, at which the government would receive zero revenue due to driving out any and all investments, wages, savings and other means of generating wealth”
Before concluding I want to briefly talk about the Laffer Curve.
The Laffer Curve theorises that there are two peak points of a tax rate, at which the government would receive 0 revenue. At the top is a 100% tax rate, at which the government would receive zero revenue due to driving out any and all investments, wages, savings and other means of generating wealth. At the bottom is 0% tax rate, at this point the government receives zero revenue because it places no rate of tax on its citizens and their activities.
While it shows at both these points the government receives 0 revenue, each peak point has different effects on citizens. At the top point the citizens’ economic activity would be non-existent and be put into positions of poverty, while at the bottom point the citizens economic activity, productivity and accumulation of wealth would be at its maximum optimal level; higher tax rates slow economic activity, lower tax rates accelerate economic activity.
So why, even if we believe what has been discussed here to be the worst of a worst case scenario, hasn’t the government seen these issues?
Well the shortest answer I can give without taking too much more of the readers time, is that it is a theoretical error with Mainstream Economics, viewing the economy as a static period; merely a mathematical formula not affected by human choice, values, ambitions and action. It is viewing economic activity as if it is not affected by externally imposed costs; that the economic actors will bring about a certain level of activity regardless of how high a tax rate is increased. It is seeing you have 12 eggs to make a large cake, taking 8 and believing you can make the exact same sized cake with 4 as you could with 12.
There is little excuse for a fallacious budget. Even if taking the assumption that such a bad budget was desperately brought in, in order to expand the governments revenue there are two problems with this:
Taking a larger amount from a small pie is not the same as taking a smaller amount from a large pie. Or, in money terms: There’s a difference between taking, say, 5% of £300 million, and 20% of £3 million.
The government already has a large revenue stream. Revenue isn’t the government’s problem, and I’m going to show this briefly before concluding:
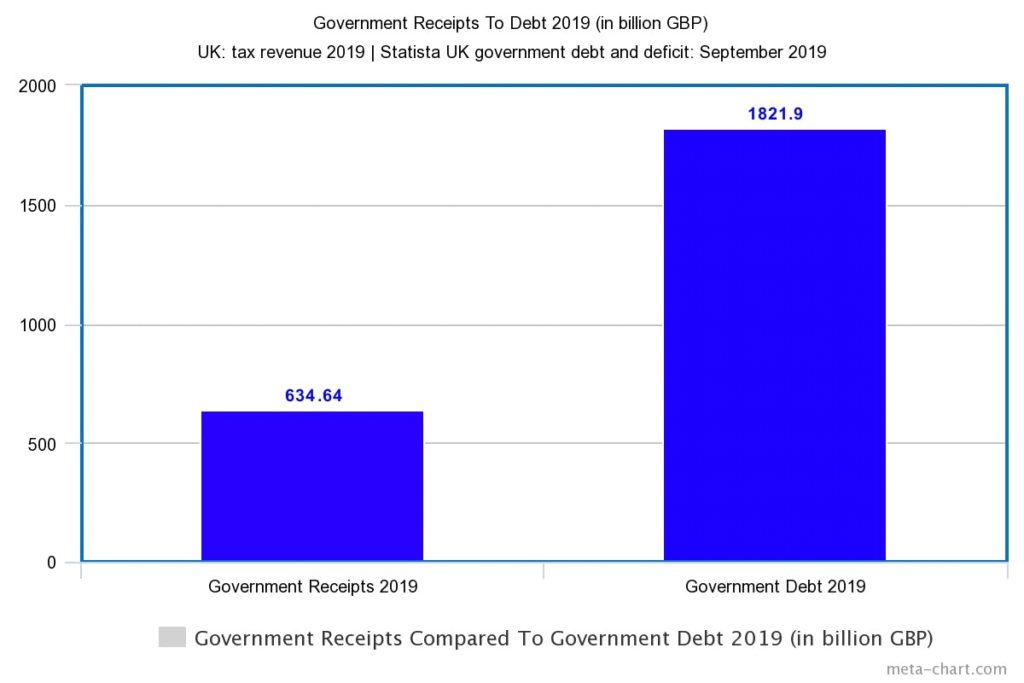
Let us compare Government debt with Government receipts; the amount of money the Government collects in a year from all sources.
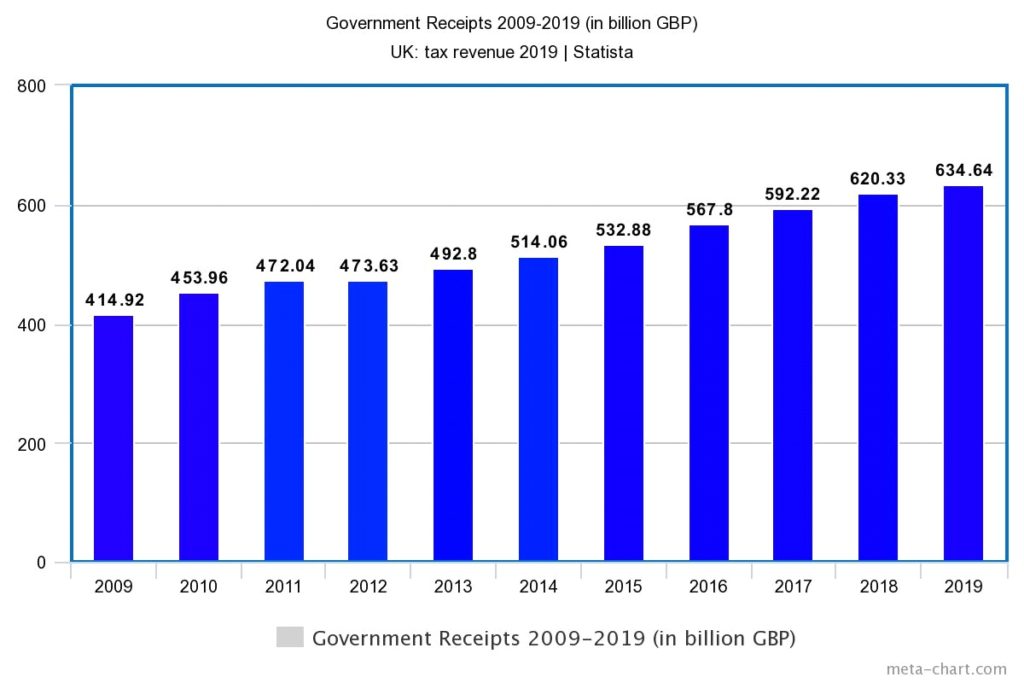
If we give the Government some leeway on its debt for the year 2020 and take a look at this ratio from the year 2019, we see the following. First it is important to look at the revenue streams from the financial years of 2009 to 2019.
As is shown, the Government receipts in the financial year of 2019 were at 634.64 billion GBP; an increase of 52.95% since the year 2009.
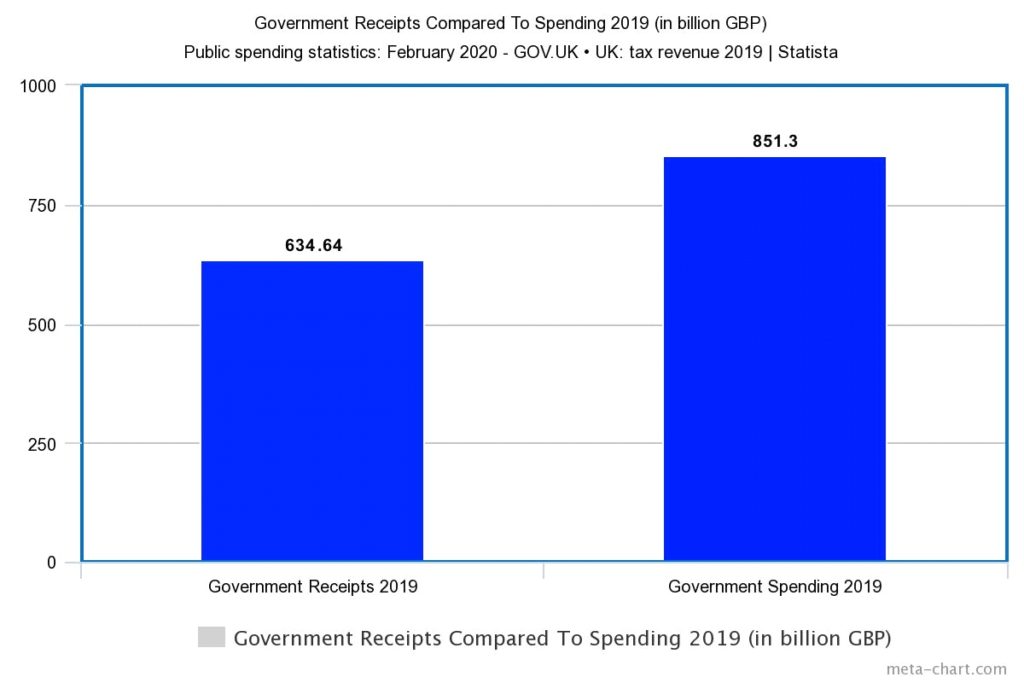
Next we look at the Government receipts compared to Government spending for the year 2019.
Government spending compared to receipts, was 851.3 billion GBP; which equates to roughly 34.13% higher than all sources of revenue collected by the Government.
Finally let’s look at the Government receipts for the year 2019 as compared to the debt as it stood in 2019.
“The Government doesn’t have a revenue shortage problem; the Government has a spending spree problem.
If the government was looking to have economic recovery, slowing down that recovery is certainly a strange way of doing it”
In quite startling results the government debt in 2019, stood at 1821.9 billion GBP; or 1.8 trillion. The government debt is 187.07% higher than the Government receipts collected from all sources.
The Government doesn’t have a revenue shortage problem; the Government has a spending spree problem.
If the government was looking to have economic recovery, slowing down that recovery is certainly a strange way of doing it; to say the least in the most polite way possible. if the Chancellor was serious about recovery, and giving the private sector a strong push off the ground, he would’ve done well to have drastic reforms to the tax system; particularly Income Tax and Corporate Tax, into low, flat rate taxes of 5% and 10%.
Politicians like to talk a lot about the private sector giving back to the public, but for a year, the private sector has made huge sacrifices; sometimes willingly, sometimes forced on to it, in order to keep the public sector afloat; perhaps then, it’s time the public sector and the government, gave back to the private… something other than more debt, preferable.
The purpose of these notes is to present some facts about the campaign to stop global warming and climate change. The climate has changed in the past, is probably changing now, and will change in the future. The campaign is trying to stop the unstoppable.
The natural factors affecting global temperature are very powerful: terrestrial, solar, galactic, and cosmic. Although the manmade contribution to CO2 levels in the atmosphere is claimed to be substantial it is actually very very small and the effect on temperature will be minimal.
1: There are 5 organisations which monitor global temperatures:
Terrestrial: GISS Goddard Institute of Space Studies. Part of NASA.; NOAA National Oceanic and Aerospace Administration (USA).; HADCRUT Climatic Research Unit, UK Met Office
Satellite
RSS Remote Sensing Systems, USA.; UAH University of Alabama, Huntsville.
They all produce slightly different figures. The terrestrial ones have been “homogenising” the figures i.e. adjusting the recent temperatures upwards and older data downwards for years. I prefer to use the satellite data which is more reliable.
“Professor Chris Holland of the Hadley Centre for Climate Prediction and Research said: “The data doesn’t matter. We are not basing our recommendations on the data. We are basing them on the climate models.” Such quotes are never mentioned in the news media”
2: Revealing statements from the Intergovernmental Panel on Climate Change (IPCC)
In 2007 the IPCC Assessment Report 4 contained the following statement in the chapter by Working Group 1 : “ The climate system is a coupled non-linear chaotic system and therefore the long term prediction of future climate states is not possible”
And it was further confirmed in 2010 by Ottmar Edenhofer Chairman of the UN – IPCC Working Group 3 who said “ One must say clearly that we redistribute de-facto the world’s wealth by climate policy. One has to free oneself from the illusion that international climate policy is environmental policy. This has almost nothing to do with environmental policy any more”. When it became clear during the temperature pause, 1999 onwards, that the forecasts were not supported by the empirical data, Professor Chris Holland of the Hadley Centre for Climate Prediction and Research said: “The data doesn’t matter. We are not basing our recommendations on the data. We are basing them on the climate models.” Such quotes are never mentioned in the news media.
3: Carbon Dioxide
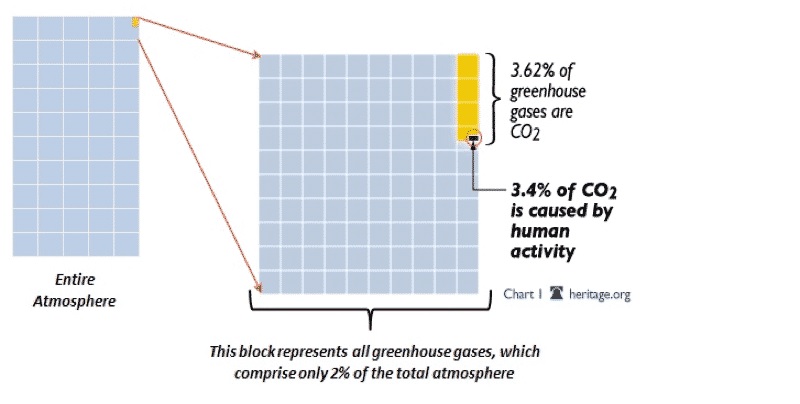
Carbon Dioxide in the atmosphere has recently been increasing by about 2 molecules per million molecules (00.0002%) per year and now stands at about 410 molecules per 1,000,000 molecules (00.04%). This is expressed as parts per million by volume (ppmv) . I prefer to express it in terms of 10,000 molecules of atmosphere. In 1900 the volume of CO2 in the atmosphere was 3 molecules in 10,000 molecules; in 2020 it was 4 molecules in 10,000; that is an increase of 1 molecule in 10,000 in a period of 120 years and that extra 1 molecule is alleged to have caused the global warming (0.8C). Is the climate of the world so delicately balanced that a change of 1 molecule in 10,000 can cause dangerous global warming? CO2 can warm the atmosphere – but not much. These facts are never mentioned in the news media.
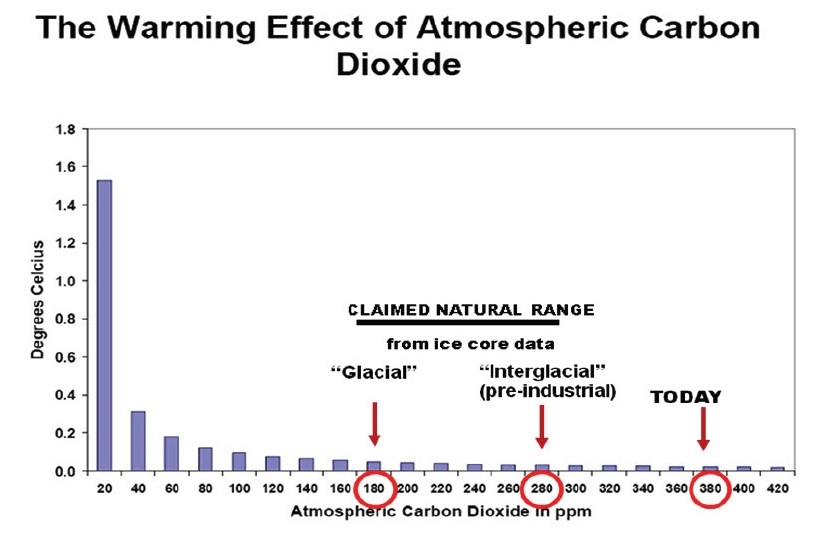
4: The warming effect of CO2 is logarithmically reducing.
This means that as more and more gets into the atmosphere the additional CO2 has less and less effect. As we are now at 410 molecules per million any additional CO2 will have only marginal effect. (see paper by Dr. David Archibald available at http://wattsupwiththat.com/2010/03/08/the-logarithmic-effect-of-carbon-dioxide). As to whether the hypothesis that manmade CO2 is having any significant effect is correct – well you can see that the answer is probably no. This is never reported in the news media.
The point is that any extra CO2 introduced into the atmosphere now will have no effect on global warming. (Archibald,D, 2007)
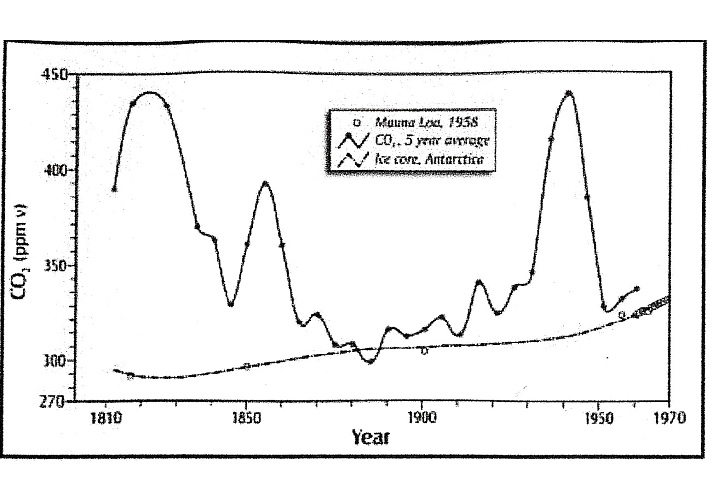
5: Measurement of CO2.
Since 1958 this has been done by the laboratory at Moana Loa, Hawaii using infra-red spectroscopy. Between 1812 and 1961 it was done in various laboratories around the world using the Pettenkofer method. In those 149 years this gave results varying from 270 ppmv to 440ppmv (1. Beck, E. 2007, Energy and Environment 18: p259-282; 2. Plimer, Heaven and Earth p 416). See the graph below. The IPCC have ignored without explanation the thousands of measurements using the Pettenkofer method with the variable results shown below except to take the lowest figure of 270 ppmv as the pre industrial era level which, apparently, is reliable while rejecting the figures of 440 ppmv in 1825 and 1940 as not reliable. Since 1958 the Moana Loa results show a consistent rise of about 2 ppmv per year. The laboratory is situated near the top of one of the largest volcanoes on earth surrounded by the warm Pacific Ocean. Volcanoes emit large quantities of CO2 and warm seas degas large quantities of CO2 also. Professor Ian Plimer states that over 80% of Moana Loa measurements are dismissed as poor data – i.e. non conforming.
Determination of atmospheric CO2 by the Pettenkofer method (solid line of 5 year averages) between 1812 and 1961, deductions of atmospheric CO2 from Antarctic ice core (gas chromatography) and edited measurements of atmospheric CO2 from Mauna Loa (infra-red spectroscopy,1958 and onwards). One method of measurement shows great variability in atmospheric CO2 yet another method does not. The high values of CO2 by the Pettenkofer method have been rejected by the IPCC yet the lowest value is used by the IPCC as the base line pre-industrial value for atmospheric CO2. Graph derived from Professor Plimer’s book “Heaven and Earth” page 420. The diagram below shows CO2 as a proportion of the atmosphere and as a percentage of the greenhouse gases.(Dr. Tim Ball www.technocracy.news.com). 2% x 3.62% x 3.4% = 00.0024%
So forecasting man’s effect on future climate in terms of doubling total CO2 is factually dishonest.
6: Growth in CO2 compared with global temperature
It is interesting to note that the increase in CO2 (derived from NOAA via Moana Loa) shows an increase of 2 parts per million per year.. Compare this with the graph which shows the CO2emissions increase per year in million metric tonnes. This calculated tremendous growth has had no impact on the annual growth measured by NOAA.
7: The life of CO2 in the atmosphere is short
There are 37 scientific papers which have examined the life of CO2 in the atmosphere. In 35 of them the findings varied between 3 years and 7 years. One of them found 25 years (Suess&Lal 1983). One of them found in excess of 100 years. The Intergovernmental Panel on Climate Change (IPCC) chooses to take 100 years . This is never mentioned in the news media.
8: Methane
Methane is widely claimed to be significant in global warming as it is 20 times more effective than CO2. Its volume in the atmosphere is about 1,800 molecules per billion i.e. less than 2 molecules per million. Yes, like CO2 it can warm the atmosphere but not much. What is more, methane quickly and spontaneously oxidises into CO2 and water. (Plimer, “Heaven and Earth” page 183). This is never reported in the news media.
9: Water vapour
Water vapour is the main warming gas and forms 95% of all the warming gases. It is beyond the control of man Water vapour has a substantial warming effect. Interestingly water vapour in the form of clouds has both a warming and a cooling effect simultaneously. The net effect is still in dispute. This is never mentioned in the news media.
10: There is one factor which destroys the CO2 hypothesis
The most fundamental assumption of the hypothesis is that an increase in CO2 will cause an increase in temperature. This assumption is programmed into the computer models and has a compound effect on forecasts. In fact every record for any period of time and duration shows that exactly the opposite happens – temperature increases before CO2. (Professor Tim Ball, Phd. The Corruption of Climate Science, page 162.) This fact is never mentioned by the IPCC or reported in the news media.
“From 1885 to 1916 the temperature was falling slightly; from 1916 to 1940 it was rising slightly; from 1940 to 1975 it was falling slightly; from 1975 to 1998 rising slightly; 1998 to 2020 there has been no statistically significant change”
11: 1885 to 2016
Between 1885 and 2016 the global temperature anomalies varied a little up and down with cold and warm spells. From 1885 to 1916 the temperature was falling slightly; from 1916 to 1940 it was rising slightly; from 1940 to 1975 it was falling slightly; from 1975 to 1998 rising slightly; 1998 to 2020 there has been no statistically significant change. This is shown in the graph below derived from www.WeatherWatch.co.uk, temperature Fahrenheit.
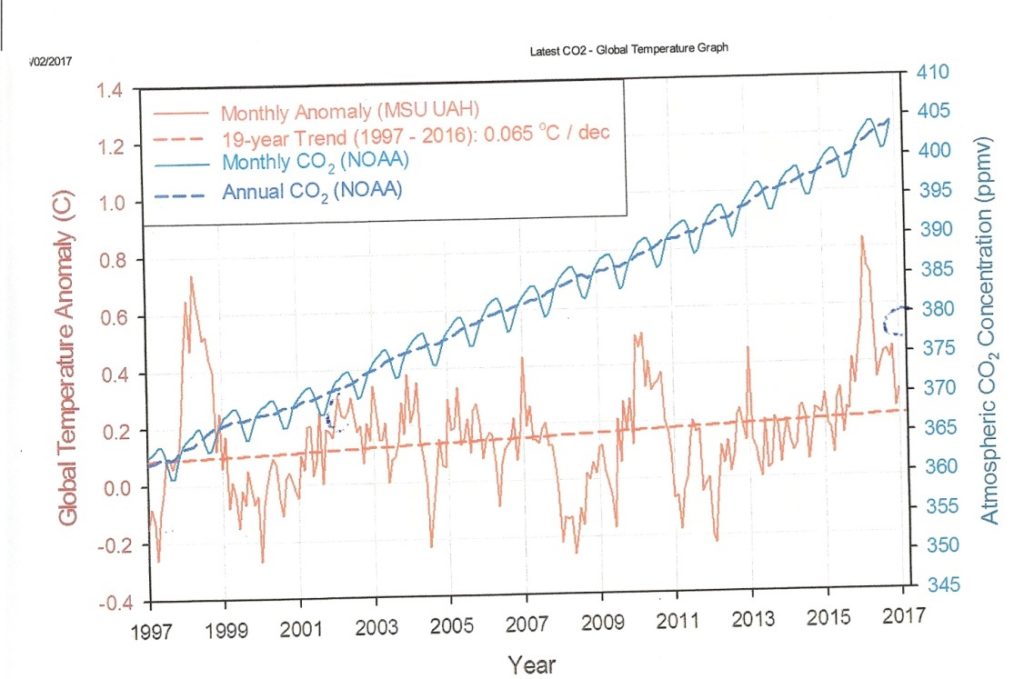
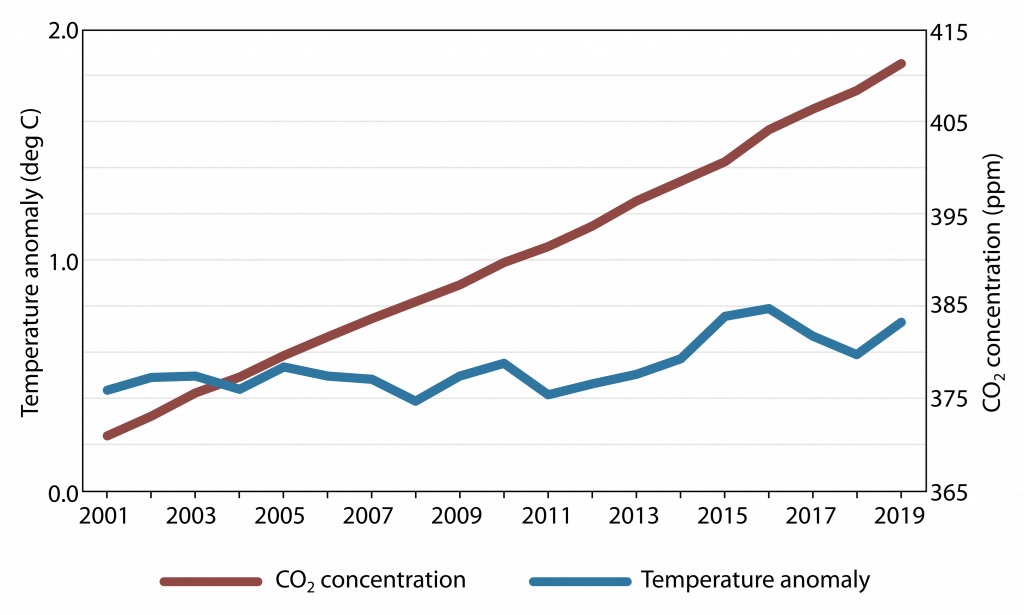
The graph below shows global temperature anomalies 1998 to 2019 published by GWPF January 2020. You can see that there is no correlation between CO2 and temperature.
According to the laboratory at Moana Loa during most of those 138 years the level of CO2 consistently rose and the hypothesis that CO2 creates dangerous global warming was formulated in the period 1975 to 1998. However, you can see that for 53 of those years the global temperature was rising and for 85 of those years it was falling or steady. Why did the temperature fall when CO2 was rising? These temperature changes can only be seen if measured in tenths of a degree This is never reported in the news media.
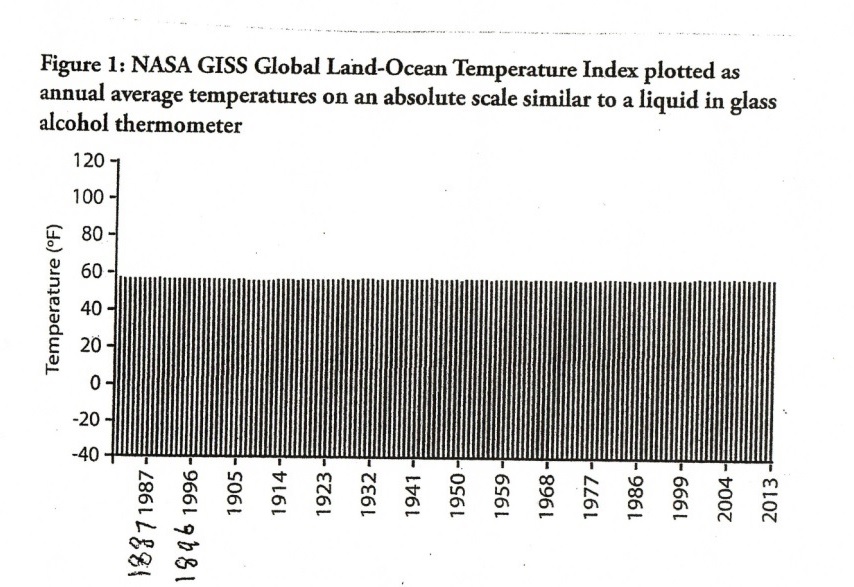
The graph below produced by Anthony Watts shows the changes in global temperature since 1887 converted to a normal wall mounted domestic thermometer.
Source:Plot of NASA GISS global average surface temperature from 1880 to 2013, with thanks to James Sexton for conversion assistance. Data derived from “Global Land-Ocean Temperature Index in 0.01 degrees Celsius, base period: 1951- 1980”, National Aeronautics and Space Administration accessed 10th July 2014 http://data.giss.nasa.gov/gistemp/table.data_v3/GLB.tstdSSTtxt
“warming from 1694 to 1730 was similar to 1988 to 2005. It is interesting to also note that the temperature recorded in 1730 was the same as that recorded in 2008. Until the effect of natural causes of global warming or cooling is established it is impossible to establish the extent of warming caused by manmade CO2 emissions. If any”
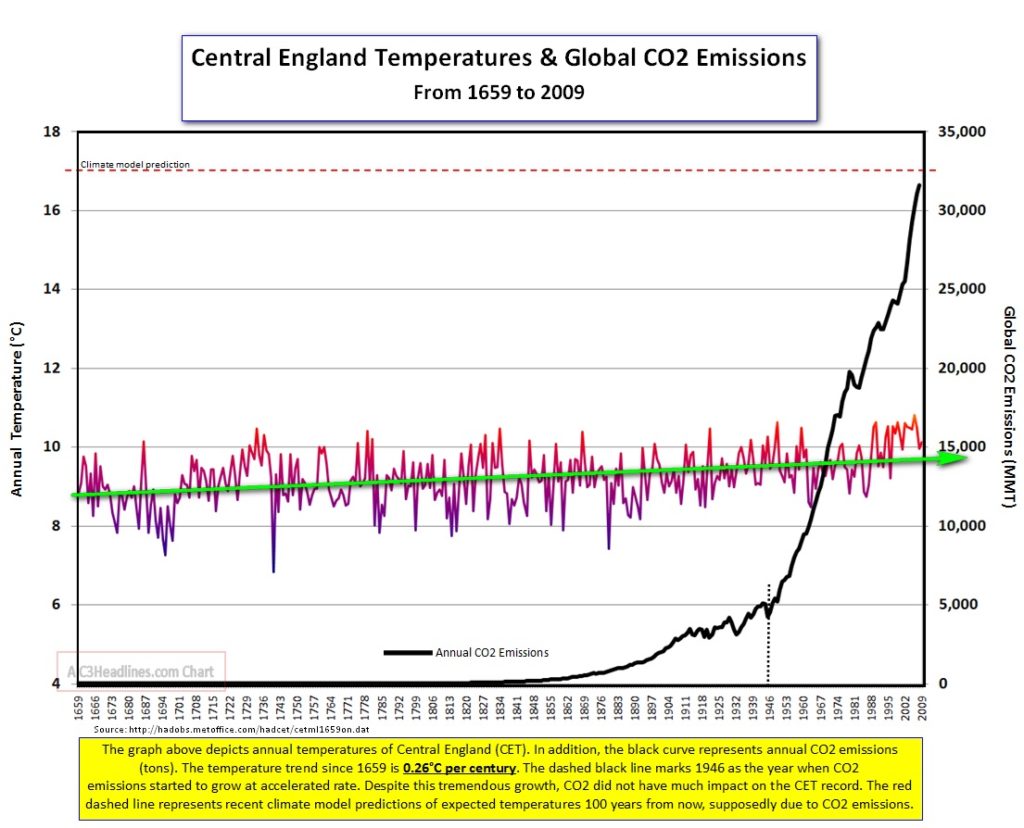
12: Global temperatures
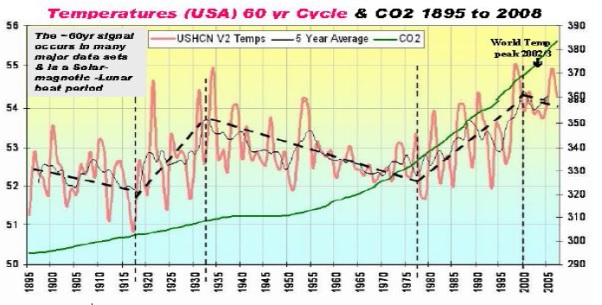
It is clear that global temperatures have risen irregularly since the Little Ice Age (at its coldest 1645 to 1715) when rivers in Europe including the Thames were regularly frozen over. The global temperature has risen at a rate of about 0.3C per hundred years since then. The Central England Temperature (CET) from 1659 shows a rise of approximately 1 degree centigrade. The graph also shows the lack of correlation between CO2 and temperature. Most of that time man produced very little CO2. Natural forces are at work. You can see that warming from 1694 to 1730 was similar to 1988 to 2005. It is interesting to also note that the temperature recorded in 1730 was the same as that recorded in 2008. Until the effect of natural causes of global warming or cooling is established it is impossible to establish the extent of warming caused by manmade CO2 emissions. If any. None of this is ever mentioned in the news media.
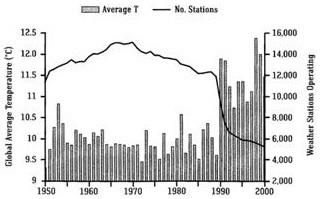
13: The reduction in the number of weather stations
The graph below derived from the National Oceanic and Atmospheric Administration (USA) shows the reduction in the number of weather stations.
Fig. 5 : Evolution of land stations and global temperature. Beginning of 1990, thousands of meteo stations located in cooler rural zones (e.g. Siberia, North Canada) stopped recording data (source :ftp://ftp.ncdc.noaa.gov/pub/data:ghcn/v2/v2.temperature.readme).
The above graph shows a reduction of approximately 8000 weather reporting stations and the effect on global temperature which has created a false warming. This is never mentioned in the AR summary reports of the IPCC. Nor is it reported in the news media.
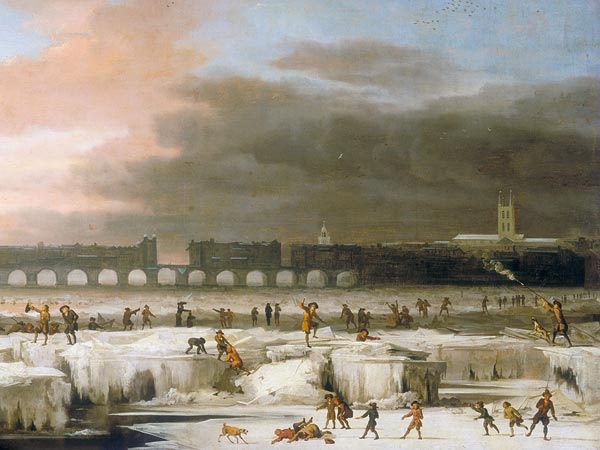
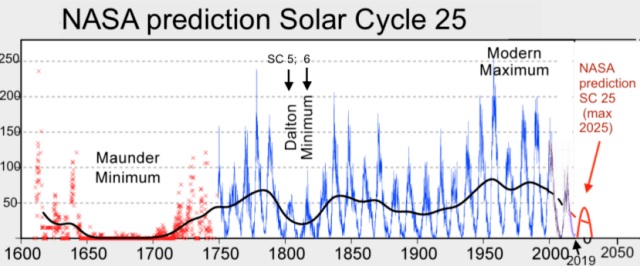
“Both NASA and NOAA have forecast that solar cycle 25 will be the lowest for 200 years. If global temperatures fall to the levels experienced in Solar Cycle 5 during which the Thames froze over at Westminster in 1814 and 1816 the implication is widespread crop failures. No Western government is making preparations for this”
14: What of the future?
Many climate scientists believe that the earth is about to enter a 30 year period of cooling based upon the present low number of sunspots. Records of sunspots show that periods of low sunspots correlate with periods of low temperature. Both NASA and NOAA have forecast that solar cycle 25 will be the lowest for 200 years. If global temperatures fall to the levels experienced in Solar Cycle 5 during which the Thames froze over at Westminster in 1814 and 1816 the implication is widespread crop failures. No Western government is making preparations for this. This is never reported in the news media.
The above painting by Abraham Hondius shows the frozen Thames in 1677.
Daily observations of sunspot numbers from 1st January 1977. Source WDC-SILSO, Royal Observ. Belgium.
The Maunder Minimum coincided with the Little Ice Age; The Dalton Minimum was another period of intense cold during which the Thames froze over in London in 1816. If the prediction by NASA is correct similarly cold temperatures can be expected. The major effect will be widespread crop failures.
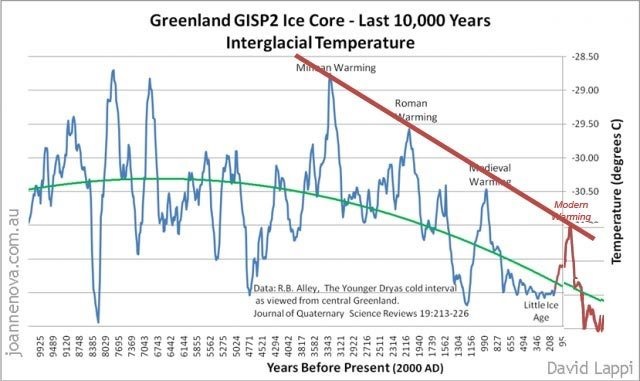
The graph below gives the temperature on the Greenland ice sheet during the last 10,000 years derived from the Greenland Ice Sheet Project 2 (GISP2) ice core. Data source from Joannanova.com.au. The direction of the trend is clear.
Professor Henrick Svensmark of the Danish National Space Institute has demonstrated the connection between sunspots and climate identifying that the flow of cosmic rays varies with the number of sunspots. A low number of sunspots allows more cosmic rays to penetrate earth’s atmosphere. A high number of sunspots reduces them. Cosmic rays ultimately develop into nuclei from which rain drops form thus forming clouds. Clouds cool the earth. Thus low sunspots allow more clouds to form leading to periods of colder climate. This process was confirmed by experiments at CERN.
15: Climate Cycles
Many astronomers and other scientists have determined that climate changes in regular cycles. Research done by Dr. Theodor Landscheit starting in 1976 and studies by Fairbridge and Sanders (Columbia University) show that our climate varies – warm to cold, cold to warm – in cycles about every 180 years giving a double cycle of 360 years. It is thought that this is due to the sun’s motion about the centre of the solar system. Research by Dr. Paul Mayewski on the Greenland Ice Sheet has identified a 1440 year cycle (Journal of Geophysical Research, 30.11.1997) of intensely cold climate which has also been identified in North Atlantic deep sea cores by Bond et al (Science, 14.11.1997). From these cycles it can be deduced that the 360 year cycle, and the 1440 year cycle are due to coincide early in the 21st century. Add to this that the last serious ice age occurred about 11,500 years ago (1440×8) and it looks possible that we are in for serious cooling followed by catastrophic cooling in the not too distant future. No government is considering this.
16: The forecasts
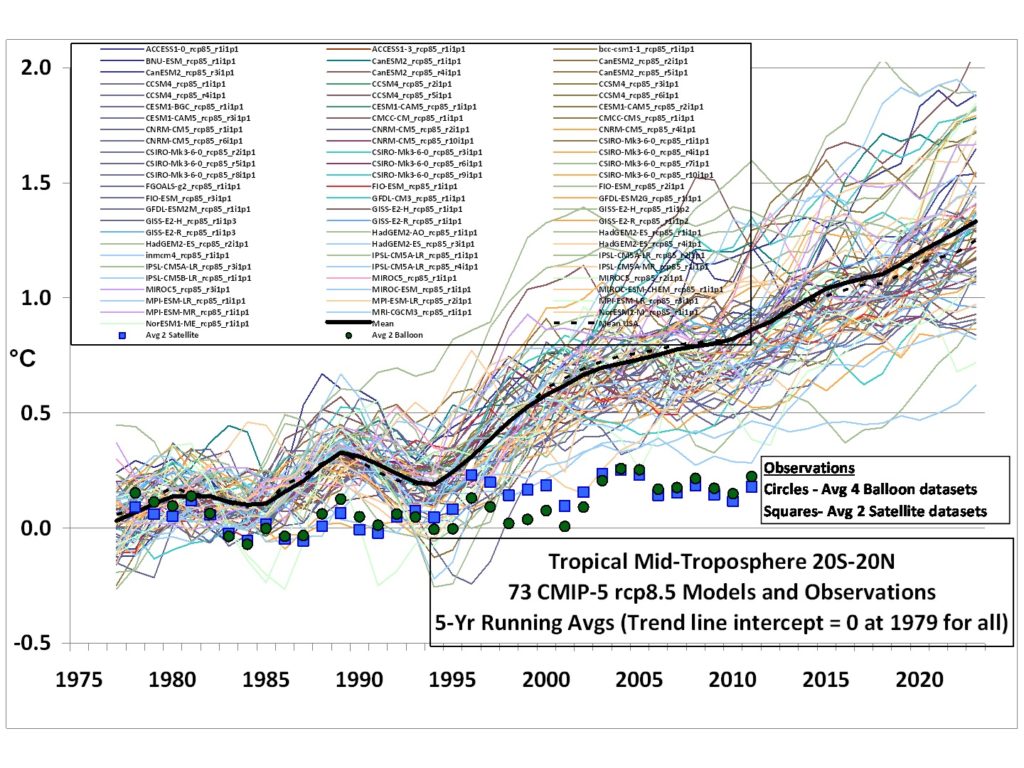
The forecasts of Catastrophic Anthropogenic Global Warming due to increasing CO2 in the atmosphere use computer models which have been severely criticised by sceptical scientists. See the graph below. Until the proportion of CO2 created by natural factors is known the proportion created by man must be unknown. This is never reported in the news media.
17: Computer models
Computer model forecasts indicate an increase in global temperature of between 2C and 6C by the year 2100. The forecasts of 73 models, upon which the IPCC relies for its Assessment Reports, are given below compared with actual observations of global temperatures 1976 to 2012. This is never reported in the news media.
A similar graph can be found in AR5 Technical Summary figure TS-14 with the following discussion in box TS3: “ However an analysis of the full suite of CMIP5 (Coupled Model Intercomparison Project) historical simulations….reveals that 111 out of 114 realisations show a GMST (Global Mean Surface Temperature) trend over 1998 – 2012 that is higher than the entire HADCRUT4 trend ensemble (box TS3 figure 1a; CMIP5 ensemble mean trend is 0.21C per decade). This difference between simulated and observed trends could be caused by some combination of (a) internal climate variability, (b) missing or incorrect RF, and (c) model response error.” GWPF 6.11.19
18: The Great Barrier Reef, Australia
At a lecture in the House of Lords on 4.11.2019 Dr.Peter Ridd,, who has spent 35 years studying the reef, presented the following: Many of the threats to the Great Barrier Reef, such as from sediments and nutrients from agricultural runoff, and from climate change (either natural or manmade), have been greatly exaggerated. Far from being in very poor condition, the GBR is actually one of the most pristine and unspoiled ecosystems on earth. The manifest discrepancy between alarmist claims and observational evidence is due to a systemic failure of Quality Assurance systems used for science and relied upon for public policy decisions. This was not reported in the news media.
19: 2014 the Warmest Year Ever
The terrestrial record (GISS, NOAA, and HADCRUT) give this impression. Between 1990 and 2000 approximately 8000 weather stations were removed from the record. These were mainly rural stations which experience cooler temperatures than urban stations because of the Urban Heat Island effect. If RSS and UAH satellite figures are used (which are far more comprehensive) 2014 turns out to have been cooler than several other years in the last 18. This is compounded with the fact that the terrestrial data records have been altered to raise modern temperatures and reduce historical temperatures (Report by Prof. F.Ewert). This is never reported in the news media.
“Over the last twenty years various “experts” such as Al Gore have predicted that the Arctic will be ice free before and including 2018. None of the forecasts came to fruition. They still haven’t”
20: Global Sea Ice
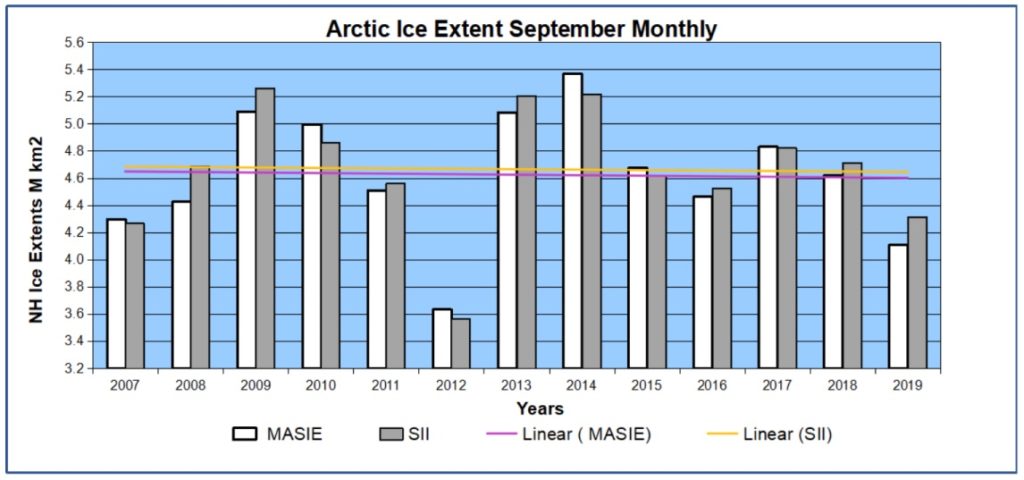
Arctic sea ice and Antarctic sea ice are seasonal. Arctic ice has slowly declined in area for 30 years but in September 2018, was 470,000 square miles (1.2 million sq kilometres) more than it was in 2012. This is more than the area of France, Germany, and Italy combined and illustrates the variability of the arctic ice.
The above graph shows the annual minimum September monthly average sea ice extent in the Northern Hemisphere from 2007 through 2019 according to two different data sets: Sea Ice Index (SII) from NOAA and Multisensor Analyzed Sea Ice Extent (MASIE) from NIC (USA National Ice Centre). The chart begins with 2007 ending a decadal decline and beginning 12 years of stochastic instabilities around a plateau. The linear trend lines are flat for both indices. The volume of ice in the Arctic has no pattern and the SII figure for 30th Sept 2020 is 4.25 million square kilometres. Although this is low it is equal to the combined areas of 22 European states and the trend shown above is not significantly affected.
Over the last twenty years various “experts” such as Al Gore have predicted that the Arctic will be ice free before and including 2018. None of the forecasts came to fruition. They still haven’t.
With regard to Antarctic sea ice January is the Antarctic summer and sea ice extent in 2020 is at the 1979- 1990 average. According to USA National Sea Ice Data Centre the Jan 2020 extent exceeded the level of 16 of the years since 1980. So for 40 years Antarctic sea ice has been variable and is now (2020) higher than it was in 1980. This is never reported in the news media.
21: Polar Bears
Polar Bear population is sparsely spread over the Arctic. The International Union for the Conservation of Nature (IUCN) in 1966 estimated that only 10,000 polar bears remained. In 2006 IUCN estimated that the population had increased to 25,000. In 2017 the number of bears is close to 30,000. Polar bear population does not depend on ice; it depends on the availability of baby seals. This is never reported in the news media.
22: Hurricanes
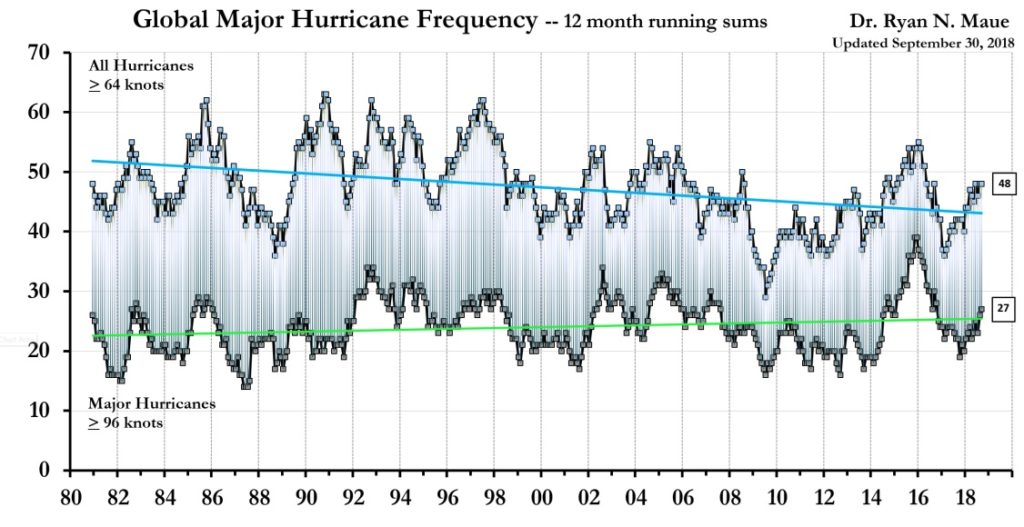
Frequency and intensity is measured using the Accumulated Cyclone Energy Index (ACE). In the last 30 years there has been a steady decline in the number and strength of hurricanes and cyclones which continues into 2020. On a scale of 1 – 5 in the last 10 years only 3 of strength 3 or higher have reached land in the USA. See the graph below.
Global hurricane frequency 38 years. Top line is the number of hurricanes exceeding 64 knots – steady decline over 38 years. Bottom line is number exceeding 96 knots – no significant increase. In that period CO2 increased by approx. 76 ppmv. And the temperature anomaly by 0.2 C
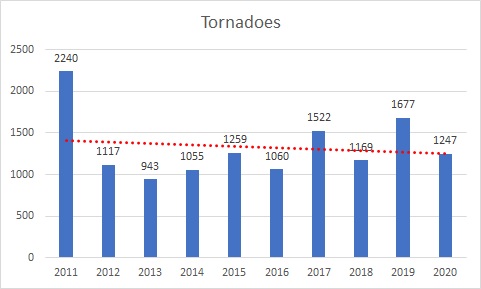
23: Tornadoes
These have been declining in frequency in the last 10 years. As shown in the graph below. The numbers are stochastically irregular but the trend is clearly downwards at present. (source spc.noaa.gov/wcm 1.1.2021)
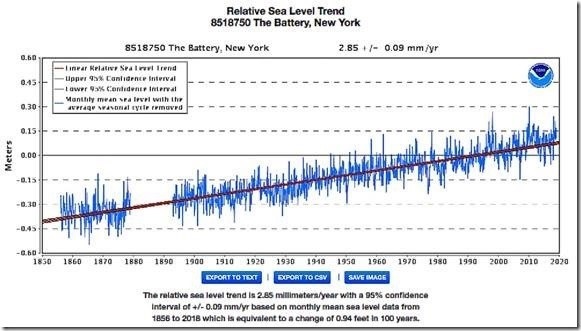
24: Sea Level
The factors affecting sea level are complex: geological, sea temperature causing expansion, and land ice melt. In the last 100 years global sea level has risen by approx. 8 inches. The current rate of increase is about 2 – 3 mm a year and this will cause a rise of about 12 inches by 2100 AD, adaptation is the best approach not the reduction of CO2 in the atmosphere. The graph below shows average sea level at New York 1830 to 2019.
25: Islands in the Pacific and Indian Oceans
A 20 year study published in 2018 has revealed that atolls and low lying islands in the Pacific and Indian Oceans are not at as much risk as has been thought. 709 islands were studied looking at data from the 1940s and it was found that no atoll lost land area and that 88.6% of islands were either stable or increased in area while only 11.4 % contracted. (GWPF 29.11.20)
26: Carbondioxide is plant food
Plants grow by photosynthesis, using water, sunlight, chlorophyll, and CO2 . CO2 is plant food without which there would be no life on earth – it is one of the basics of the food chain and if it falls below 250 molecules per million, plants will struggle to grow. If it falls below 150 molecules per million then vegetation growth is likely to cease.
27: CO2 warming – No Basis in Science
To establish a theory in science it is necessary to follow the Scientific Method. This requires experimental work and the publishing of a paper including all the detailed workings setting out the hypothesis. Other scientists test the hypothesis or compare it with actual observations. If the hypothesis is validated it is accepted as a theory – until someone else disproves it. No laboratory experiment has ever proved that CO2 has the capacity to substantially warm the atmosphere. The New Zealand Climate Science Coalition has offered a $NZ10,000 prize to the first person to prove that man made CO2 can cause dangerous global warming. Similarly, Professor Peter Ward, BA,PhD, of Columbia University, USA, has offered a prize of $US10,000 for the first person to do so. Neither has ever been claimed. This is never reported in the news media.
28: Electric vehicles
In order to unnecessarily achieve net zero carbon dioxide emissions and stop the unstoppable, governments have committed to banning the internal combustion engine and converting to electric vehicles by 2050. In the case of the UK the additional electricity required will require the output of six additional nuclear power stations. This will involve an enormous misallocation of national resources. Furthermore in order to get that electricity to the batteries of the EVs will require the complete rewiring of the UK. Thousands of transformer stations will need upgrading; the distribution cables from the transformer stations to households will need upgrading and this will involve the digging up of almost every urban street in the UK. This will be a further misallocation of £billions of pounds of financial resources and create a massive amount of CO2. The UK government has made no plans for this. This is never reported in the news media.
29: IPCC motivation
The terms of reference of the Intergovernmental Panel on Climate Change are to examine global warming in the light of Manmade CO2. As a result they do not give consideration to scientific reports which identify different causes or which falsify the reports on which they base their hypothesis. A list has been compiled since 2014 by the website No Tricks Zone which details over 3000 scientific papers which express scepticism of the IPCC “science”. They also, apparently, ignore inconvenient empirical evidence.
“Their target is to reach net zero emissions by 2050. They say that net zero provides the opportunity for “intentional societal transformation” and do not hide their belief that capitalism and economic growth threaten the future of the planet”
30: NetZero
Their target is to reach net zero emissions by 2050. They say that net zero provides the opportunity for “intentional societal transformation” and do not hide their belief that capitalism and economic growth threaten the future of the planet. They seek to replace capitalism with top down coercive central planning on a global scale encompassing energy, manufacturing, construction, transportation, agriculture, and land use. (GWPF report 40, Rupert Darwall). Their motivation is political aiming to create a system of world government by the UN general assembly secretariat with real power using climate change as a vehicle. The whole agenda has been hijacked by extremists seeking to undermine the economy and social stability of European countries. (Dr.Peiser, GWPF 10.9.19)
31: The Plan
Their plan was revealed at the IPCC conference in Copenhagen 2009. A draft treaty (see below) was submitted for approval by the conference which in clause 38 provision was made for a 3 part system of control: Government; Facilitative mechanism; Financial mechanism. The details were very intrusive, effectively controlling national economies to achieve UN objectives. In fact a system of world government run by unelected UN officials. The draft treaty was not approved but the cat was out of the bag. For the avoidance of doubt clause 38 of the draft treaty is provided in paragraph 32 below.
32: Draft Treaty
UN Intergovernmental Panel on Climate Change
Copenhagen 2009 Draft Treaty Clause 38
38. The scheme for the new institutional arrangement under the Convention will be based on three basic pillars: government; facilitative mechanism; and financial mechanism, and the basic organization of which will include the following:
(a) The government will be ruled by the Conference of the Parties with the support of a new subsidiary body on adaptation, and of an Executive Board responsible for the management of the new funds and the related facilitative processes and bodies. The current Convention secretariat will operate as such, as appropriate. FCCC/AWGLCA/2009/INF.2 Page 19
(b) The Convention’s financial mechanism will include a multilateral climate change fund including five windows:
(a) an Adaptation window,
(b) a Compensation window, to address loss and damage from climate change impacts, including insurance, rehabilitation and compensatory components,
(c) a Technology window;
(d) a Mitigation window; and
(e) a REDD window, to support a multi-phases process for positive forest incentives relating to REDD actions. (REDD, Reducing Emissions from Deforestation and Degradation)
(c) The Convention’s facilitative mechanism will include:
(a) work programmes for adaptation and mitigation;
(b) a long-term REDD process;
(c) a short-term technology action plan;
(d) an expert group on adaptation established by the subsidiary body on adaptation, and expert groups on mitigation, technologies and on monitoring, reporting and verification; and
(e) an international registry for the monitoring, reporting and verification of compliance of emission reduction commitments, and the transfer of technical and financial resources from developed countries to developing countries.
The secretariat will provide technical and administrative support, including a new centre for information exchange.
Alternative to paragraph 1–38
[The shared vision shall take the form of preambular text that encapsulates both the long-term global goal and pulls together the other elements of the agreed outcome, in the following form:
The Conference of the Parties,
Seeking to further implement the Convention, in light of evolving science and mindful of evolving economic development and emissions trends,
Recognizing, in the light of Article 2 (objective) of the Convention, the importance of identifying one or more reference points in the mid-century timeframe that can guide the efforts of the Parties and the international community and against which aggregate global efforts can be continually assessed,
Considering, in that regard, that [ ] is/are desirable global indicator(s), Having a shared vision of [summary that ties together the elements of the agreement],
33: Conclusions
Many peer reviewed papers have been published putting forward causes for warming other than CO2. However, what is needed to stop the madness that has seized governments around the world, and which is causing enormous misallocation of the world’s resources, is a rational consideration by experts, from both sides of the argument, of the evidence for warming caused by CO2. This is a widely used technique in industry and commerce known as a Red/Blue assessment to resolve a controversial issue. This must be organised preferably independent of any government agency.
Consideration must also be given to the evidence of natural climate change. Until the contribution of natural change to the warming or cooling of the climate is established it is impossible to establish if manmade CO2 has any effect.
Recognition of the true purpose of the UN’s climate change hypothesis must be publicised.
Withdrawal from the targets set by the 2015 Paris Conference and repeal of the Climate Change Act 2008 and subsequent legislation is now urgent.
Even the most ardent Remainers must be breathing a sigh of relief that the UK isn’t currently involved in the vaccine chaos engulfing Europe.
17 countries including Germany, France, Italy and Spain made the controversial decision to suspend the use of the AstraZeneca vaccination in the wake of reports that the vaccine could cause serious blood clots.
Italy has admitted that the move to halt the use of the AstraZeneca vaccine was political and sputnik spoke with Michael Swadling from the Croydon Constitutionalists to find out just how damaging this move could prove to be in the fight against the pandemic and why this has is evidence that Brexit has been good for Great Britain.it. But surely, surely, the job of a nation, of a government, is to protect their people’s health. And in this case, put their differences behind them, and actually copy what Great Britain has done and get this vaccine out to people”
“isn’t that they won’t achieve the goal. In the end, it isn’t that they won’t get people vaccinated. But that slowness of the vaccine is just a window of opportunity for the virus to kill more people”
“Local decisions throughout life are always better than decisions in a far away bureaucracy.The closer decisions are made to the person the more suited they are to their needs. Britain had that opportunity as a nation to say what’s best for our interests. And our interests might be different from France’s interest. They might be different from Germany’s interests”
I have been studying climate change for 12 years by reading books on the subject (I have over 30) and researching scientific papers available on the internet. There is much to say but put as briefly as possible I have come to the following conclusions.
“Those seeking to stop the changes are trying to stop the unstoppable and the policies which have been introduced to achieve this are very harmful to the economy, and the scary forecasts based on computer models are exaggerated”
Climate change is a natural function principally caused by the sun and other factors which are terrestrial, galactic, and cosmic. These influences are very powerful. The climate has changed in the past, is changing now, and will change in the future. Those seeking to stop the changes are trying to stop the unstoppable and the policies which have been introduced to achieve this are very harmful to the economy, and the scary forecasts based on computer models are exaggerated. Models are not evidence and too much real evidence has been ignored by the Intergovernmental Panel on Climate Change, which consists of politicians who write the Executive Summary for Decision Makers. Many of the panel’s own scientists have publicly disagreed with the summaries. They have been sacked or ignored.
I believe it is necessary for the Climate Change Act 2008 to be repealed so that an enquiry can establish what is likely to happen by examination of real historical evidence and then embark on a program of mitigation where the effects are likely to cause economic disbenefits, adaptation where necessary, and development when the effects are beneficial.
“Science is never settled, it merely establishes hypotheses which stand until a future scientist proves them wrong. Science must be established on the principle of the scientific method using real evidence, not models”
Much is made of the claim that “The Science is Settled”. This ignores the powerful forces referred to above. Science is never settled, it merely establishes hypotheses which stand until a future scientist proves them wrong. Science must be established on the principle of the scientific method using real evidence, not models, from which to draw conclusions taking account of the forces mentioned above. No laboratory experiment has ever proved that CO2 dangerously warms the atmosphere.
Those politicians and scientists who promote the hypothesis that carbon dioxide and methane emitted into the atmosphere are causing catastrophic global warming ignore two fundamental facts. The first is that the capacity of those gases to warm the atmosphere is logarithmically reducing. This means that as more and more CO2 gets into the atmosphere the extra gas has less and less effect and we are already at a point where additional CO2 will have only a very small effect. The second fact is that today CO2 forms only four molecules in every 10,000 molecules of atmosphere. In the last 70 years it has increased by one molecule in 10,000. Yes, that is indisputable. I ask the question:- can a change in the nature of one molecule in 10,000 cause catastrophic global warming? I am forced to the answer NO! CO2 can warm the atmosphere a little, but not much. In the case of methane there is less than two molecules in 1,000,000 molecules of atmosphere. This is also indisputable. The principal gas which warms the atmosphere is water vapour the volume of which in the atmosphere is beyond the control of mankind.
“The real empirical evidence shown by the present lack of sunspots is leading many scientists to the view that a cold spell is imminent”
To reduce the cause of modern climate change to only one variable, CO2, and to a small proportion of that variable, is not science. It is pseudo science. The real empirical evidence shown by the present lack of sunspots is leading many scientists to the view that a cold spell is imminent.
In view of the worldwide misallocation of resources I believe that a rational consideration of the factors involved is long overdue, natural climate change must be taken account of, the true purpose of the IPCC CO2 reduction campaign must be publicised, and the Climate Change Act 2008 and subsequent legislation must be repealed.
Marco Di Paola is the new London & South East Coordinator for the UK Libertarian Party. Their sister party in the US finished third in last year’s Presidential Election. We have spoken with Marco’s predecessor in London and others from the party. We catch-up with Marco about what brought him into politics, and his thoughts and views for the party in London and beyond.
Marco, thanks for your time.
Can you start by telling us a bit about your background, and how did you became the London & South East Co-ordinator for the Libertarian Party?
I considered myself a Conservative until the EU referendum in 2016, after which I found myself appalled at how politicians from all sides of the spectrum were so keen to try and overturn a democratic mandate. I had a frustrating period where I couldn’t find a party that aligned to my principles and values and it was only when I took the Political Compass test that I discovered Libertarianism. I’ve been a member of the Libertarian Party for a few years and had started to contribute to the local Facebook Page when I was asked to become the co-ordinator for Sussex. A very short time later, there was a vacancy for the London & South East position and I was eager to step up.
“I think it’s unfortunate that the current mayor is likely to be re-elected based on which party he represents rather than his ability to do the job. From an outside perspective, all I see is virtuous posturing but little action of relevancy”
In May we have the Mayoral and GLA elections in London. The Libertarian Party has endorsed Laurence Fox for Mayor. What’s made the party endorse Laurence and more widely what are your thoughts on the upcoming elections?
The Libertarian Party strongly oppose all lockdowns so when Laurence Fox declared he would lift lockdown if elected, we weren’t prepared to stand in his way! I think it’s unfortunate that the current mayor is likely to be re-elected based on which party he represents rather than his ability to do the job. From an outside perspective, all I see is virtuous posturing but little action of relevancy.
We’ve had a year of lockdown restrictions, which should be fertile ground for Libertarians, but we see the Conservative government polling strongly. What do you think is happening on Britain’s support for lockdown, and what are your thoughts on the past year?
Its been a tough time for Libertarians, that’s for sure! It’s clear to me that the government propaganda has scared people so much into accepting this level of restrictions on our liberties. We aren’t even able to have a sensible debate on whether lockdowns are an appropriate or proportionate response without being accused of wanting to ‘kill granny’ or ‘let the virus rip’. I personally don’t feel there should ever be a situation where government has this sort of power over it’s population but I could understand the argument more if all members of society where at equal risk of being seriously ill or dying from the virus. The fact is that Covid 19 is a nasty virus for some but the majority of people who get it will be ok. The demographics of who are most at risk are very clear and I really feel we should have looked at focussed protection for the most vulnerable as proposed by ‘The Great Barrington Declaration’. My biggest fear and main reason why I oppose these blanket measures is that once the state has these powers they will not let them go easily. This is evidenced now by the fact we have the 2nd lowest infection rate in Europe, continued falling hospitalisations and deaths and one of the highest vaccination rates in the whole world yet we still have one of the strictest lock downs worldwide! Boris’ roadmap is quite frankly a disgrace. How can it remain illegal to have friends or family in your own home until at least May 17th despite all the data showing that the virus is in decline and the vaccinated are protected? It is outrageous.
“We are only ever told about left vs right in politics and I think that’s for a reason; why would the establishment want you to know that there is a philosophy and way of being that means you don’t need them!?”
How do you feel the Libertarian message in London goes down, and what do you see as the key messages for the capital?
I feel its really difficult for people to understand libertarianism and what it really means. I think people don’t even know its a ‘thing’. We are only ever told about left vs right in politics and I think that’s for a reason; why would the establishment want you to know that there is a philosophy and way of being that means you don’t need them!? I think its important we help people see that a system that encourages individual responsibility, freedom to make your own choices and free markets will provide everyone a greater opportunity to thrive.
How do you plan to grow the party and extend its reach in London?
It’s all about awareness for us. Its really difficult to get any traction in the mainstream media so we are looking forward to the launch of GB News where hopefully they will be more open to giving a platform to parties such as ours.
We’re a Croydon based group, as you know our council has issued a Section 114 notice and declared de facto bankruptcy. What do you think about what’s happened in Croydon, also would you and if so how would you, change local government financing?
It’s the fundamental problem with the public sector; they don’t have the ‘rudder of profit’ to guide them. There is no consequence for poor service because citizens i.e. customers don’t have the choice to take their business elsewhere. They are forced to fund failing organisations and receive a lesser service for it! It is illogical. Regarding local government funding, you have to reduce the size of the state as much as possible and allow citizens to keep as much of their own money to spend how they need. I really do believe that business, charity and volunteers will step in and provide what people need far more efficiently and effectively than any publicly run institution ever could.
“I would persistently challenge them on all areas of spending and be unashamedly looking to reduce the size of the council itself. I want citizens to keep as much of their own money as possible so they can spend it on services that actually deliver value to them directly“
You are running in the Tarring ward for both Worthing Borough and West Sussex County Council. What are the major issues facing the town and county, and if elected what’s one thing you like to achieve?
On a larger scale, the town will be decimated by the effects of lockdown and I feel people are really blinded by this due to the various handouts given by central and local governments. I am a huge advocate of allowing private business to operate in a way that they deem appropriate for their own customers and not to have to answer to top down mandates. Equally, I encourage individuals to think about their own responsibility and enable them the freedom to choose how they want to live and what businesses they want to give their custom to. Locally, a major gripe currently is the increase in council tax year on year for a lesser service. In particular, the county council reduced refuse collection to a fortnightly service and are now making it as difficult as possible for citizens to access the tip by cutting opening times and, bizarrely, introducing a process of attendance only by pre booking! As usual, councils and public services treating its customers as inconveniences and you wouldn’t get away with it in the private sector. If elected I would aim to be a thorn in the side of the bureaucrats on the council. I would persistently challenge them on all areas of spending and be unashamedly looking to reduce the size of the council itself. I want citizens to keep as much of their own money as possible so they can spend it on services that actually deliver value to them directly.
“People who are pro tax only ever consider it from a ‘rich’ person’s perspective (‘they should pay more!’) but I tend to think about how many of the taxes such as VAT and sin taxes are really regressive and disproportionately effect the worst off”
If you could introduce 3 changes to how we are governed what would they be?
Firstly, power needs to be devolved to as close to the individual as possible. It makes no sense to me that people with no understanding of local issues get to decide what is important and what our money should be spent on. Secondly, I want the state to be as small as possible and work towards a system whereby people have the freedom to make their own choices on what is best for them without being tied to certain policies and processes. Thirdly, we need a simplified and lower tax system. Its quite ridiculous the number of taxes there are and how we are constantly taxed on money that has already been subject to taxation. People who are pro tax only ever consider it from a ‘rich’ person’s perspective (‘they should pay more!’) but I tend to think about how many of the taxes such as VAT and sin taxes are really regressive and disproportionately effect the worst off.
Any thoughts you would like to leave our readers with and how can people get involved.
Politics isn’t about left v right any more but rather authoritarianism v libertarianism. If you value freedom to live your life how you wish we need to collectively stand up and challenge the rise of authoritarianism as this past year has evidenced how far we have moved away from liberty and truly being a free country.
Marco is standing in both the Worthing Borough and West Sussex County Council elections in his local ward of Tarring on May 6th, and we wish him all the best. You can contact him at marcodipaola@libertarianpartyuk.com. The Libertarian Party are online at https://libertarianparty.co.uk/.
The TaxPayers’ Alliance have published an update on Croydon Council written by Mike Swadling of this parish.
“Ambitious for Croydon” was the Labour Party’s motto when they were duly elected to run Croydon again in 2018. Certainly, the plans have been ambitious; as has the spending that went with them. Whilst the budgets that underpinned these goals have largely received cross-party support, things quickly spiralled out of control, as many had predicted”
“makes it all the more galling that the council was forking out vast sums of local residents’ money on things such as solar panelled bins – and now they need to close rubbish tips, which will no doubt lead to more fly-tipping!”
“Croydon’s councillors voted to reduce £300,000 from councillor pay from April 2021. Better late than never, but this will still likely leave Croydon’s councillors in the top 20 per cent best remunerated in the country and top six in London. Is this really fitting for cabinet members who oversaw only the second council bankruptcy this century?”
“Against this backdrop, Croydon’s hard-pressed taxpayers are bound to ask what has changed. Highly paid executives and well-remunerated councillors oversaw a fiasco that has left local households to pick up the tab for many years to come.”
We are joined by Harry Wilkinson, Head of Policy at the Global Warming Policy Forum. Harry talks about the GWPF and the issues caused by the Government’s policy of net zero carbon emissions. We then chat about the thriving polar bear population and the censorship of those sceptical of the “Climate Emergency”.
We are joined by Mary Lawes, a councillor in Folkestone for The Foundation Party, as we discuss the Lockdown Exit Roadmap, what the post-Brexit Trade Deal has not done for fishermen and the ongoing scandal of cross Channel illegal immigration. We then chat about the upcoming local elections and Mary’s campaign in Kent.