
By Jerry Wraith
1 INTRODUCTION
The most important issue about BREXIT was that no-one could precisely predict how well or badly the UK would do after BREXIT as it was all in the future. The “Remainers” continually talked about damage to the UK economy, lost trade, influence, etc. but could not substantiate any of these claims with facts. However, because we had already been in the EEC/EU for over 40 years the “leavers” had plenty of facts to prove what a total political and economic disaster membership of the EU had been for the UK. Thankfully the general public saw through the wild claims made by the Remainers and voted to leave.
“it is time to summarise the horrendous costs of being in the EU and how the EU has systematically fleeced the UK, and its taxpayers, over the period of the UK’s membership”
Unfortunately, since then the substantial benefits of Brexit have not been pursued actively enough to convince the remainer fraternity how much better off we could and should be. Even now, groups of people are still agitating for the UK to re-join the common market, and even to re-join the EU. The Liberal Democrats even has a policy to re-join the EU, despite the overwhelming democratic vote to leave in 2016. Why these rejoiners wish to re-join the undemocratic, un-economic EU is an absolute mystery!
Hence, it is time to summarise the horrendous costs of being in the EU and how the EU has systematically fleeced the UK, and its taxpayers, over the period of the UK’s membership to enlighten them.
2 SUMMARY OF PREVIOUS AND FUTURE COSTS OF BEING IN THE EU 2.1 PREVIOUS COSTS
2.1.1 COST OF CUSTOMS UNION UP TO AN EXTRA £1,000 to £2,700/YEAR/HOUSEHOLD?
NB In 2014 UK exporters to the EU saved just under £80/household in import duties. Yet in 2014 it cost UK householders up to an extra £1,000 to £2,700/household because the UK was in the EU! A bad deal for UK householders and taxpayers.
2.1.2 TRADING WITH THE EEC/EU SINCE 1973 to 2021: DEFICIT OF £2.07 TRILLION NB Trading with the rest of the world from 1973 to 2021: SURPLUS of £850 billion! 2.1.3 ANNUAL COST OF BEING IN THE EU CURRENTLY £221 BILLION? 2.1.4 POSSIBLE COST OF BEING IN THE EU FOR 45 YEARS £13.22 TRILLION
2.1.5 TOTAL CURRENT COST TO 2021 OF UK NETT BUDGETARY PAYMENTS TO THE EU: £343 BILLION
NB This vast total cost all had to be borrowed and must currently cost the UK nearly £9 billion/annum in interest charges on this cost alone, which does NOT include the annual interest charges on the cost of borrowing all the annual sums.
2.1.6 CURRENT LIABILITY OF BEING IN THE EU UP TO £441 BILLION EUROS 2.1.7 LOSS OF FISHING RIGHTS SINCE JOINING £100 to £150 BILLION 2.2 EXTRA FUTURE COSTS ON RE-JOINING THE EU
2.2.1 SUPPORTING THE FUTURE COST, €32 TRILLION, OF PAY AS YOU GO EU PENSIONS
2.2.2 COST OF CONVERTING FROM POUNDS TO EUROS: £53 BILLION? 2.2.3 SUPPORTING BANKRUPT EU COUNTRIES: ITALY, SPAIN, PORTUGAL 3 COST OF CUSTOMS UNION UP TO AN EXTRA £2,700/YEAR/HOUSEHOLD?
3.1 It was claimed during the referendum campaign and elsewhere that being in the customs union cost the average household up to an extra £1,000/annum. This figure was referred to by Tim Congdon on page 30 in his 2013 report “How much does the European Union cost Britain?” and comes from an OECD report quoted by Booker and North in their book “The Mad Officials”.
NB Sir Patrick Minford later claimed, (Sunday Express, 25th March 2018) that leaving the Customs Union would save the UK £80 billion/annum. This is equivalent to £2,700/household.)
3.2 Congdon later quotes on page 25 of his 2015 report that resource misallocation costed over 3.25% of GDP. Currently GDP is approximately £2 trillion. Hence 3.25% of this is £65 billion or about £2,170/household. Congdon states on page 16 of the report, referred to above, that the average British household “pays” the EU £750/year as a direct fiscal cost to finance the UK’s contribution to the EU budget.
3.3 These extra costs must hurt poorer households, the Labour Party’s traditional support base, the most. So why does the Labour Party support staying in the EU and making their supporters suffer so much?
3.4 The only conceivable benefit for being in the EU is that by belonging to the tariff free customs union UK exporters saved, about 1% on EU import duties, Ref 3.1.
3.5 In 2014, the amount saved on import duties by UK exporters was about 1% or less than £3 billion at £2.28 billion. This amounted to about £76 for each UK taxpayer.
3.6 So the Labour Party, which is partly funded by the trade unionists political levy, is expecting their members (there are 7 million trade unionists) to pay an extra £1,000/head/annum (or £2,700/head?) to save UK exporters to the EU on average just £76/head/annum. Not a good deal for UK households and trade unionists!
3.7 The EU is a Customs Union. This means that goods produced by EU countries are protected by imposing tariffs on goods imported from outside the EU. The EU tariff on dairy products is particularly high, (probably to protect inefficient French farmers) at 35.4%. This hit
the UK hard as much of the UK’s food is imported. It also hit New Zealand very hard as the UK was New Zealand’s prime importer of New Zealand butter and lamb. Some EU tariffs on non-EU imported goods are listed in Figure 3.1 derived from Ref 3.2.
3.8 So, why is the UK in the EU at all? Clearly big UK business exporters to the EU can save, on average, £75/head on EU tariffs. This means more money for their shareholders, directors etc. These same businesses probably fund the LibLabCon political parties and tell them what to do. Is this why the UK is in the EU, despite the huge costs to the UK economy and its citizens and taxpayers?
FIGURE 3.1 EU TARIFFS ON NON-EU IMPORTED GOODS
While the UK is a member of the EU, there are no tariffs on trade with other EU member states. Goods imported into the EU from non-EU countries pay the EU’s common external tariff unless there is a free trade agreement or preferential trade agreement. The tariff rate differs between different goods. While on average EU tariffs are low, they are high for some products, especially agricultural products. The trade weighted average EU tariff for non-agricultural products was 2.3% in 2014 and 8.5% for agricultural products. The table below gives a breakdown by type of product.
WTO, World Tariff Profiles 2017, pg. 82 Average EU tariff by product type (%)
- Animal products 15.7
- Dairy products 35.4
- Fruit, vegetables and plants 10.5
- Coffee, tea 6.1
- Cereals and preparations 12.8
- Oilseeds, fats and oils 5.6
- Sugars and confectionery 23.6
- Beverages and tobacco 19.6
- Cotton 0.0
- Other agricultural products 3.6
- Fish and fish products 12.0
- Minerals and metals 2.0
- Petroleum 2.5
- Chemicals 4.5
- Wood, paper etc 0.9
- Textiles 6.5
- Clothing 11.5
- Leather, footwear etc 4.1
- Non-electrical machinery 1.9
- Electrical machinery 2.8
- Transport equipment 4.3
- Other manufactures 2.6
- Source: WTO World Tariff Profiles 2017, p82
Ref 3.1 House of Commons Library, “The economic impact of EU membership on the UK”, Standard Note SN/EP/6730, September 2013. (Quoted in Brexit Magazine No 2, published by the Better Off Out Campaign.) Ref 3.2 House of Commons Briefing Paper, Number 7581, 4 July 2018, “Statistics on UK-EU Trade” by Matthew Ward.
“only a relatively small portion of our economy is tied to trade with the rapidly diminishing market, which is the EU, the fact is, that trading with the EEC/EU since 1973 has currently, in 2021 figures, resulted in the UK building up a £2.07 trillion deficit”
4 TRADING WITH THE EEC/EU SINCE 1973 TO 2021: DEFICIT OF £2.07 TRILLION
4.1 Remainers continually claimed that we must stay in the single market or there would be a disastrous effect on our economy due to loss of trade etc., with the EU.
4.2 Apart from the fact that only a relatively small portion of our economy is tied to trade with the rapidly diminishing market, which is the EU, the fact is, that trading with the EEC/EU since 1973 has currently, in 2021 figures, resulted in the UK building up a £2.07 trillion deficit, see APPENDIX 4.1. (In addition, there are vast overhead costs due to being in the EU. This is discussed in para 5 below).
4.3 This figure represents the current cost, in 2021 values, of the total balance of trade with the EEC/EU since we joined in 1973. It clearly demonstrates how much better it has been for the EU by the UK being in the EU than the other way round and why the EU is so antagonistic about BREXIT.
4.4 Over roughly the same period the current balance of trade with the rest of the world (ROW) was a surplus of £850 billion i.e., a third of our current national debt! See APPENDIX 4.1.
4.5 The Treasury claimed that BREXIT and coming out of the EU with no deal or a bad deal would cost our economy up to 8% loss in GDP in 2025 or thereabouts. However, this figure was probably engineered to support “Project fear” as the European Research Group (ERG) supported the Economists for Free Trade estimate of an £80 billion boost the UK economy over 5 years.
4.6 Trade is a complicated subject, and we import goods from the EU to make things that sell in the EU and the ROW etc., but Joe Public the voter, can surely appreciate the difference between a surplus, (PROFIT), of £850 billion trading with the ROW and a deficit, (LOSS), of £2.07 trillion trading with the EU. Unfortunately, the Labour, Lib Dem parties, far too many Conservatives and delusional remainers apparently can’t!
4.7 Furthermore, the free trade deal with the EU cost the UK taxpayer £billions every year due to lost income from UK import duties on their larger exports to the UK. In addition, import duties paid by UK taxpayers on non-EU goods imported into the UK was lost to the UK treasury as it was claimed by the EU as an EU “own resource”.
NOTES:
4.10 Being in the EU since 1973 has been a 45 year “investment” for the UK. It is relatively pointless just looking at the results for I, 2 or even 5 years. We need to see how good or bad this investment has been for the UK over the whole period.
4.11 Furthermore it is necessary to correct all the figures to the present day. This means that they can all be added up on the same basis.
4.12 I am satisfied that the University of Illinois web site “measuringworth.com” using the “project function” is acceptable for this correction exercise. Some years ago, I was not aware of the website and calculated the total current BoT total from 1973 to 2009 of all the BoT figures. I used the BoE annual interest rates and calculated the interest on the balance annually, in a manner similar to mortgage payments. The total I got using this method was £930 billion compared to the University of Illinois result of £914 billion.
4.13 Please note that although the UK has built up such a large deficit with the EU the actual exports to the EU have not been discussed. The point is that the UK gains no advantage in trade by being in the EU, (see below) and has made a surplus trading with the ROW. Hence UK exports to the EU, although important, would probably have been much better if the UK was OUTSIDE the EU.
4.14 The UK’s export performance would also be even better if many UK industries had not been decimated by EU diktats and by the EU making UK industries move their businesses to other EU countries. Some of these are listed in APP 4.2.
4.15 The adverse effect of being in the EU is clearly demonstrated by the graph in APPENDIX 4.3 which clearly shows how membership of the EU has severely blighted UK trading results since 1973.
4.16 Further proof of the wholly pointless effect of being in the EU “for trade” is clearly proven by Michael Burrage in his report “Where’s the Insider Advantage?” published by Civitas. I have copied an appendix from his report as Appendix 4.4.
4.17 From Burrage’s report the following facts can be established;
The table in Appendix 4.4 lists the top 35 fastest growing exporters of goods to the 11 founding members of the EU’s single market between 1993 and 2011. The table is taken from the report “Where’s the insider advantage”? by Michael Burrage, published by the think-tank Civitas, except for the fourth column which has been added by this author. It proves beyond any doubt that;
• it was NOT necessary to be a member of the EU to access the EU single market and export successfully to the EU
• it was NOT necessary to have a trade agreement with the EU to export successfully to the EU and,
• the USA, China and Russia are the top three largest non-EU trading partners of the EU, none of which have trade agreements with the EU or membership in the EU single market. They trade based on the rules of the World Trade Organisation (WTO).
• Hence the UK did NOT NEED TO BE IN THE EU to trade with the EU or with other countries.
This is a complete contradiction of the UK government position
Even worse, all the countries associated in any way with the EU through membership (UK) or EFTA (Norway, Switzerland,) are generally not doing as well in their export performance to the EU as many countries outside the EU.
In his report2, Burrage importantly concludes that;
There is no case that EU membership is good for UK exports or foreign direct investment
• The fact that the UK was the second largest net contributor to the EU’s budget clearly did not grant us any favours when it comes to exports to the EU.
• The UK has not had a balance of trade surplus in goods since 1981, after just 8 years of joining the EEC. (Due partly or mainly to being in the EU?)
• Even if it is claimed that our poor trading performance was not entirely due to being in the EU it is abundantly obvious that being in the EU did not in any way help to prevent it.
• Furthermore, out of the EU, the UK must be in a much stronger exporting position with the rest of the world (ROW) without the enormous overhead cost (£200+ billion/pa) of being in the EU.
Hence being OUTSIDE the EU the UK should also increase its exports to the EU!
APPENDIX 4.1
TOTAL ANNUAL BALANCE OF TRADE (£ BILLIONS) BETWEEN UK THE EU AND THE REST OF THE WORLD (ROW) CORRECTED TO 2021 FIGURES
| YEAR | UK/EU | 2021 | ACCUM | YEAR | UK/ROW | 2021 | ACCUM | ||
| BoT | BoT | ||||||||
| 1972 | 0 | 0 | 0 | 1972 | 0 | 0 | 0 | ||
| 1973 | -1.674 | -47.48 | -47.48 | 1973 | 0.678 | 19.23 | 19.23 | ||
| 1974 | -2.592 | -64.9 | -112.38 | 1974 | -0.59 | -14.77 | 4.46 | ||
| 1975 | -2.831 | -57.07 | -169.45 | 1975 | 1.308 | 26.41 | 30.87 | ||
| 1976 | -2.536 | -42.95 | -212.4 | 1976 | 1.764 | 29.81 | 60.68 | ||
| 1977 | -2.215 | -32.17 | -244.57 | 1977 | 2.268 | 32.97 | 93.65 | ||
| 1978 | -2.92 | -36.41 | -280.98 | 1978 | 4.043 | 50.37 | 144.02 | ||
| 1979 | -2.995 | -31.46 | -312.44 | 1979 | 2.542 | 26.68 | 170.7 | ||
| 1980 | 0.815 | 7.28 | -305.16 | 1980 | 2.028 | 18.13 | 188.83 | ||
| 1981 | 1.694 | 13.55 | -291.61 | 1981 | 5.054 | 40.43 | 229.26 | ||
| 1982 | 0.813 | 5.91 | -285.7 | 1982 | 3.836 | 27.89 | 257.15 | ||
| 1983 | 0.041 | 0.27 | -285.43 | 1983 | 3.488 | 23.05 | 280.2 | ||
| 1984 | -1.029 | -6.32 | -291.75 | 1984 | 2.511 | 15.41 | 295.61 | ||
| 1985 | -1.496 | -8.39 | -300.14 | 1985 | 3.734 | 20.87 | 316.48 | ||
| 1986 | -8.832 | -45.84 | -345.98 | 1986 | 7.968 | 41.37 | 357.85 | ||
| 1987 | -12.889 | -60.19 | -406.17 | 1987 | 8.086 | 37.78 | 395.63 | ||
| 1988 | -18.175 | -75.77 | -481.94 | 1988 | 1.7 | 7.09 | 402.72 | ||
| 1989 | -20.811 | -78.39 | -560.3 | 1989 | -1.587 | -5.99 | 396.73 | ||
| 1990 | -18.393 | -63.61 | -623.94 | 1990 | -0.353 | -1.22 | 395.57 | ||
| 1991 | -5.793 | -18.98 | -642.92 | 1991 | -2.161 | -7.08 | 388.43 | ||
| 1992 | -11.823 | -37.4 | -680.32 | 1992 | 1.69 | 5.35 | 393.78 | ||
| 1993 | -13.207 | -39.68 | -720 | 1993 | 2.451 | 7.36 | 401.14 | ||
| 1994 | -12.523 | -35.71 | -755.71 | 1994 | 10.104 | 28.81 | 429.95 | ||
| 1995 | -12.5 | -33.95 | -789.66 | 1995 | 9.608 | 26.1 | 456.05 | ||
| 1996 | -5.485 | -13.96 | -803.62 | 1996 | 1.296 | 3.31 | 459.36 | ||
| 1997 | -4.845 | -11.8 | -815.42 | 1997 | 5.349 | 13.01 | 472.37 | ||
| 1998 | -5.923 | -13.74 | -829.16 | 1998 | -2.032 | -4.64 | 467.73 | ||
| 1999 | -11.5 | -25.57 | -854.73 | 1999 | -3.4 | -7.56 | 460.17 | ||
| 2000 | -8.1 | -17.09 | -871.82 | 2000 | -10.1 | -21.3 | 438.87 | ||
| 2001 | -15.9 | -32.26 | -904.08 | 2001 | -8 | -16.23 | 422.64 | ||
| 2002 | -27.7 | -53.92 | -958 | 2002 | -3.6 | -7.01 | 415.63 | ||
| 2003 | -31.3 | -57.56 | -1015.56 | 2003 | 3.2 | 5.89 | 421.52 | ||
| 2004 | -34.3 | -60.08 | -1075.64 | 2004 | 0.7 | 1.23 | 422,75 | ||
| 2005 | -36.2 | -59.93 | -1135.57 | 2005 | 3.4 | 5.63 | 428.38 | ||
| 2006 | -27.2 | -42.68 | -1178.25 | 2006 | -3.2 | -5.02 | 423.36 | ||
| 2007 | -34.7 | -51.15 | -1229.4 | 2007 | 3 | 4.48 | 427.84 | ||
| 2008 | -31.2 | -45.22 | -1274.62 | 2008 | -1.7 | -2.46 | 425.38 | ||
| 2009 | -29.3 | -43.6 | -1318.22 | 2009 | 6.4 | 9.52 | 434.9 | ||
| 2010 | -32.1 | -46.13 | -1364.35 | 2010 | 1.9 | 2.73 | 437.63 | ||
| 2011 | -23.5 | -32.13 | -1396.48 | 2011 | 6.7 | 9.3 | 446.93 | ||
| 2012 | -38.4 | -51.69 | -1448.17 | 2012 | 17.2 | 23.15 | 470.08 | ||
| 2013 | -49.1 | -63.45 | -1511.62 | 2013 | 25.6 | 33.08 | 503.16 | ||
| 2014 | -57.8 | -71.38 | -1583 | 2014 | 24.7 | 30.5 | 533.66 | ||
| 2015 | -70.6 | -84.53 | -1667.53 | 2015 | 40.7 | 48.73 | 582.39 | ||
| 2016 | -74.8 | -85.94 | -1753.47 | 2016 | 41.8 | 48.03 | 630.42 | ||
| 2017 | -69.5 | -76.79 | -1830.26 | 2017 | 43 | 47.51 | 677,93 | ||
| 2018 | -72.4 | -77.15 | -1907.41 | 2018 | 44.1 | 46.99 | 724.92 | ||
| 2019 | -77.2 | -79.31 | -1986.72 | 2019 | 56.5 | 58.05 | 782.97 | ||
| 2020 | -49.4 | -53.23 | -2039.95 | 2020 | 53.7 | 57.86 | 840.83 | ||
| 2021 | -27.18 | -27.18 | -2067.13 | 2021 | 9.18 | 9.18 | 850.01 | ||
| TOTALS | -1097.5 | -2067.1 | -2067.13 | TOTALS | 426.563 | 850.01 | 850.01 |
BoT SOURCES; 1973 to 1998 “How much does the EU cost Britain”? by G Batten
1999 to 2021 Commons Library Briefing, 3rd Dec 2021 “Statistics on UK -EU trade” CBP 7851
Correction to 2021 values using Project Comp. of University of Illinois web site measuringworth.com
“Cadbury moved factory to Poland 2011 with EU grant.
Ford Transit moved to Turkey 2013 with EU grant.
Jaguar Land Rover has recently agreed to build a new plant in Slovakia with EU grant”
APPENDIX 4.2
UK BUSINESSES THAT HAVE MOVED TO THE EU, POSSIBLY WITH EU GRANTS
- Cadbury moved factory to Poland 2011 with EU grant.
- Ford Transit moved to Turkey 2013 with EU grant.
- Jaguar Land Rover has recently agreed to build a new plant in Slovakia with EU grant, owned by Tata, the same company who have trashed our steel works and emptied the workers pension funds. Peugeot closed its Ryton (was Rootes Group) plant and moved production to Slovakia with EU grant. British Army’s new Ajax fighting vehicles to be built in SPAIN using SWEDISH steel at the request of the EU to support jobs in Spain with EU grant, rather than Wales.
- Dyson gone to Malaysia, with an EU loan.
- Crown Closures, Bournemouth (Was METAL BOX), gone to Poland with EU grant, once employed 1,200. M&S manufacturing gone to far east with EU loan.
- Hornby models gone. In fact, all toys and models now gone from UK along with the patents all with EU grants. Gillette gone to eastern Europe with EU grant.
- Texas Instruments Greenock gone to Germany with EU grant.
- Indesit at Bodelwyddan Wales gone with EU grant.
- Sekisui Alveo said production at its Merthyr Tydfil Industrial Park foam plant will relocate production to Roermond in the Netherlands, with EU funding.
- Hoover Merthyr factory moved out of UK to Czech Republic and the Far East by Italian company Candy with EU backing.
- ICI integration into Holland’s AkzoNobel with EU bank loan and within days of the merger, several factories in the UK, were closed, eliminating 3,500 jobs
- Boots sold to Italians Stefano Pessina who have based their HQ in Switzerland to avoid tax to the tune of £80 million a year, using an EU loan for the purchase.
- JDS Uniphase run by two Dutch men, bought up companies in the UK with £20 million in EU ‘regeneration’ grants, created a pollution nightmare and just closed it all down leaving 1,200 out of work and an environmental clean-up paid for by the UK taxpayer. They also raided the pension fund and drained it dry. UK airports are owned by a Spanish company.
- Scottish Power is owned by a Spanish company.
- Most London buses are run by Spanish and German companies.
- The Hinkley Point C nuclear power station to be built by French company EDF, part owned by the French government, using cheap Chinese steel that has catastrophically failed in other nuclear installations. Now EDF say the costs will be double or more and it will be very late even if it does come online. Swindon was once our producer of rail locomotives and rolling stock. Not anymore, it’s Bombardier in Derby and due to their losses in the aviation market, that could see the end of the British railways manufacturing altogether even though Bombardier had EU grants to keep Derby going which they diverted to their loss-making aviation side in Canada.
- 39% of British invention patents have been passed to foreign companies, many of them in the EU The Mini cars that Cameron stood in front of as an example of British engineering, are built by BMW mostly in Holland and Austria. His campaign bus was made in Germany even though we have Plaxton, Optare, Bluebird, Dennis etc., in the UK. The bicycle for the Greens was made in the far east, not by Raleigh UK but then they are probably going to move to the Netherlands too as they have said recently.
From a blog by Keith Sutton, 15 June 2016 (Most of these are disputed by the I love the EU fraternity).
APPENDIX 4.3
Graphs on Balance of Payments since 1945
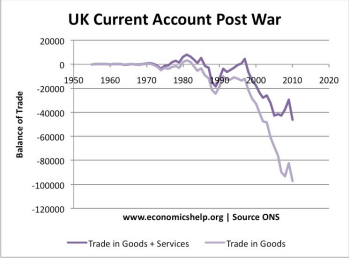
FROM:
UK Balance of Payments
Tejvan Pettinger October 2, 2015, trade
The graph above clearly demonstrates the crippling effect of EU membership and imposed regulations on the UK’s manufacturing ability. The effect of EEC/EU regulations took a few years from 1973 to start taking effect but since 1981 the decline in UK export performance is remarkably similar to the imposition of annual EU regulations and increasing costs to the UK economy of being in the EU. No doubt other factors have played a part in the decline, but the fact remains that this is the performance of UK exporters while the UK is in the EU.
Further proof of the EU’s effect on UK trade was reported by Christopher Booker in his Sunday Telegraph column (05 Dec 2004) that even the EU admitted in its report on competitiveness that if the EU’s regulatory burden could be reduced to that of the USA, then the EU’s GDP would increase substantially. From the EU’s figures Booker quoted that for the UK the annual cost of the EU’s regulatory burden alone was then about £100 billion/annum.
APPENDIX 4.4
TOP 35 FASTEST-GROWING EXPORTERS OF GOODS TO 11 FOUNDING MEMBERS OF THE EU SINGLE MARKET 1993–2011
Rank % growth Exports/month in 2011 Annual Cost of Being in EU
in US $(1993) In US $bn (2011) in £ Billions (2014)
1 Vietnam 544 0.4 0 2 Qatar 496 0.3 0 3 Ukraine 446 1.1 0 4 China & Hong Kong 429 15.3 0 5 United Arab Emirates 402 2.8 0 6 Russia 377 7.8 0 7 India 367 3.4 0 8 Brazil 357 3.4 0 9 Turkey* 295 6.2 0 10 Nigeria 250 1.1 0 11 Australia 243 2.6 0 12 South Africa* 224 2.1 0 13 Chile* 198 0.6 0 14 Korea* 197 3.0 0 15 Mexico* 176 2.1 0 16 Morocco* 170 1.5 0 17 Singapore 163 2.3 0 18 New Zealand 147 0.3 0 19 Canada 142 2.3 0 20 Bangladesh 129 0.1 0 21 Bahrain 129 0.1 0 22 US 126 22.2 0 23 Switzerland* 114 11.8 ? 24 Saudi Arabia 114 2.3 0 25 Norway* 114 2.7? 26 Kenya 99 0.1 0 27 Egypt* 96 1.1 0 28 UK 81 23.9 190
29 Israel* 51 1.5 0 30 Japan 51 4.7 0 31 Taiwan 50 1.5 0 32 Iceland* 48 0.1 0 33 Thailand 48 0.9 0 34 Kuwait 21 0.3 0 35 Indonesia 12 0.6 0
Source: www.oecd-ilibrary.org.OECD database Monthly Statistics of International Trade * Countries with trade agreements with the EU.
The table above is taken from the report “Where’s the insider advantage”? by Michael Burrage, published by the think-tank Civitas, except for the fourth column which has been added by this author
5 ANNUAL COST OF BEING IN THE EU CURRENTLY £221 BILLION?
5.1 It must also be noted that being in the EU in 2014 could have cost the UK economy £190 billion/annum, (“How much does the European Union cost Britain?”, 2015 version by Prof Tim Congdon). There are obvious conclusions to be drawn from this figure:
• This is an overhead on the whole UK economy. Out of the EU this vast additional cost on the operations of our exporters and our infrastructure can be severely reduced or preferably eliminated.
• This will enable UK exporters to reduce their costs making their goods more attractive, not only to the ROW but to the EU as well.
• Without this vast EU induced overhead the UK will be able to compete for exports to the EU on the same terms as the USA, Japan, China etc. plus many other countries that are not in the EU and not subject to the EU overhead and do not even have a trade deal with the EU.
• Clearly the vast exports from the USA, Japan, China etc are all made under WTO rules and using these rules should therefore not be a problem to UK exporters who have already made a SURPLUS trading with many countries in the ROW using these rules up to 2021
• It was only recently (after 45 years of experience) that ANYONE in the government acknowledged that being in the EU cost the UK a vast amount of money. This was when Jacob Rees Mogg introduced a sunset clause for abolishing many EU imposed laws by 31st Dec 2023. This was clearly being done to benefit UK businesses.
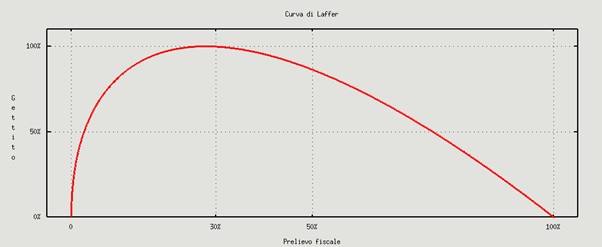
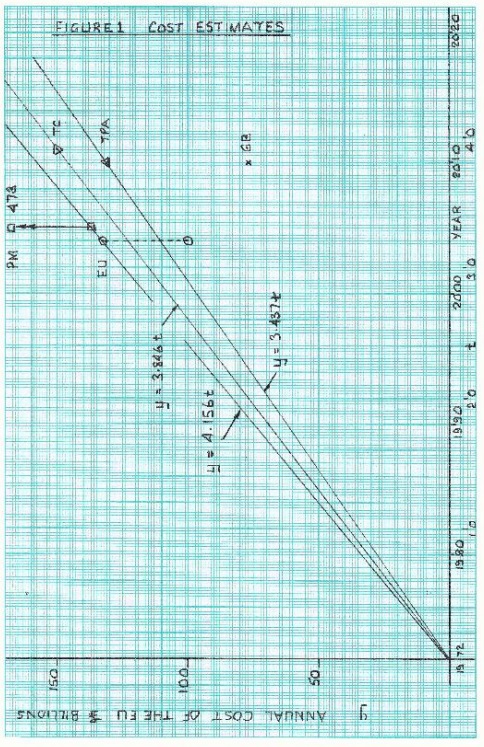
5.2 Congdon’s figure of £190 billion/annum can clearly be argued about by other economists. To put it into context I have plotted various cost estimates on the graph reproduced as Figure 5.1, which are discussed below.
a) The indirect costs which include the costs of applying and administering the thousands of EU Directives and Regulations imposed upon the UK public by the un-elected, un-sackable and unaccountable bureaucrats in the EU are enormous. Unfortunately, these costs are the most contentious to consider as no UK government has ever published any figures and they have all, without exception, absolutely refused to carry out an honest and meaningful cost/benefit analysis. Clearly the results would be so bad for their policy of commitment to EU membership that they would find it impossible to justify continued membership on financial terms alone.
b) Some attempts at estimating this cost for individual years have been made. The Taxpayers Alliance (TPA) has proposed a total figure of £130.6 billion for the year 2010. This figure was quoted in the Daily Express Special Edition, published on Saturday, 8th January 2011.
c) In his booklet Batten quotes that for the year 2010 the total direct and indirect costs amounted to £77 billion by a simple summation. But Batten (GB) takes great care to point out throughout his booklet that he always used the lowest estimates of costs wherever possible to avoid being accused of bias. Batten’s figure is considered to be far too low for the following reasons.
d) Christopher Booker pointed out in his Sunday Telegraph column (05 Dec 2004) that even the EU admitted that for the UK the annual cost of the EU’s regulatory burden alone was about £100 billion. If one assumes that the EU regulatory burden is approximately 75% of the total annual cost of being in the EU (see Daily Express, Special Edition, 2011) then the total annual cost due to being in the EU for 2004 could
have been, according to the EU estimate, approximately £133 billion. As this figure is derived from an EU figure it is used as a benchmark against which the estimates below can be assessed.
e) Professor Tim Congdon (TC) recently estimated the total annual cost as £150 billion, and this is assumed to apply to 2011. See his booklet “How much does the EU cost Britain?” published in 2012, which continues the series of booklets started by Batten in 2005.
f) Professor Patrick Minford CBE, (PM) of the Cardiff Business School estimated in 2005 that being in the EU cost the UK between 11% and 38% of GDP, (see blogs.lse.ac.uk/europpblog/2012/09/17/Britain-leave the/euro/) he confirmed that the figures he quoted still seem to be of the right order of magnitude. So, in 2005 as the GDP was £1245 billion, he estimates the cost of being in the EU was between £137 billion to £473 billion and £160 to £545 billion in 2010.
g) These estimates are plotted on Figure 5.1 and it can be seen that Congdon’s figure of £150 billion is approximately mid-way between the EU and TPA figures. Hence, using Congdon’s result, we should have a fairly reliable figure for the annual cost to the UK economy of being in the EU of £150 billion for the year 2011. This figure equates to a cost of being in the EU of £17 million/hour, approximately equivalent to the cost of the annual salaries of 10 nurses, soldiers or policemen every minute we are in the EU!
5.2 Congdon has done further analyses of the annual cost to the UK of being in the EU. In his reports “How much does the European Union cost Britain?” he quotes £150 billion/annum for 2011 in his 2012 report, £165 to £170 billion/annum for 2012 in his 2013 report, £185 billion/annum in his 2014 report and £190 billion/annum for the year 2014 in his 2015 report. Sadly, he stopped producing these reports after that.
5.3 The annual costs he estimated rose as a % of GDP from 10% in 2011, 11% in 2012 and 12% in 2014. So the annual cost of being in the EU was clearly rising much faster than our GDP.
5.4 Using Congdon’s figure of £190 billion/year for 2014 we can assume that the annual rate of increase for the cost of being in the EU is approximately £4.52 billion/year. Hence the total accumulated cost for the UK of being in the EU since 1973 to 2017 is calculated in APP 5.1 and this shows that the total accumulated annual cost of being in the EU from 1973 to 2017 could have currently cost the UK economy nearly £11 trillion.
NOTE: This is NOT being put forward as a definitive figure for the total cost. It is merely being added to indicate how much the UK economy could have suffered through being in the EU for 45 years due to EU over-regulation etc. All the elements that made up that cost are listed in Congdon’s reports.
5.5 Hence all those remainers who claim the UK economy will suffer when we leave the EU are clearly unaware of the potential cost of EU membership to our economy, are lying about it or are simply ignoring it.
FIGURE 5.1 VARIOUS ANNUAL COST ESTIMATES OF BEING IN THE EU
“This shows that the total current cost of the UK’s budget payments to the EU from 1973 to2021 was £310,523 billion, or 13.7% of the UK’s current national debt of nearly £2.5 trillion”
6 TOTAL COST OF UK PAYMENTS TO THE EU BUDGETS: £ 310.5 BILLION
6.1 Since the UK joined the EU in 1973 it had to make payments into the EU annual budget. The rates that various countries had to pay are fixed by the EU every few years.
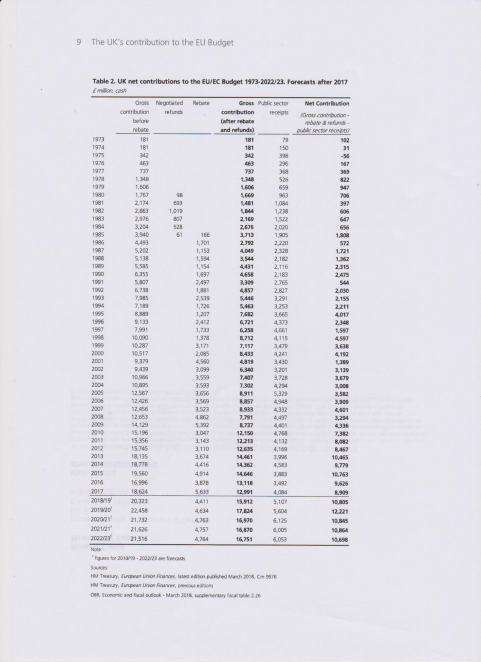
6.2 The total NETT contributions to the EU budget are shown in APP 6.1 below. This table is extracted from HoC Briefing Paper, Number CBP 7886, 2 February 2018 10. It shows the Net UK budget contributions from 1973 to 2017 in annual cash payment terms.
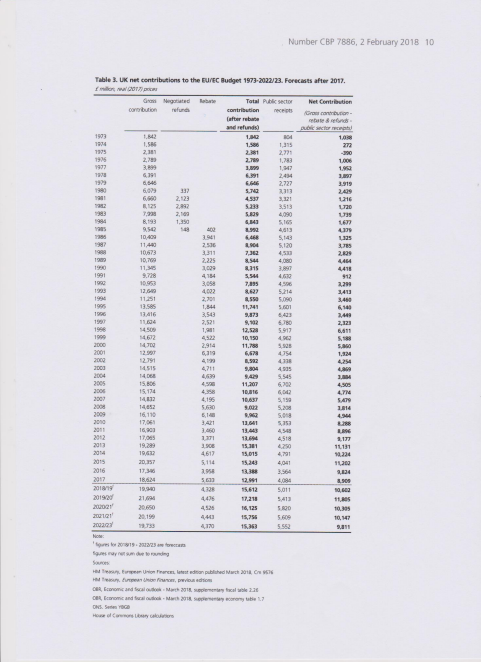
6.3 App 6.2 below shows the same payments, but the final net budget payments are corrected to 2017 values by the HoC library.
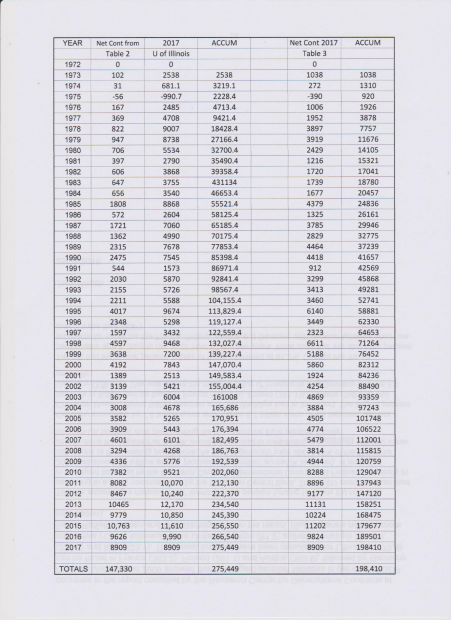
6.4 APP 6.3 lists the HoC budgetary payments in cash terms, corrected to 2017 values using the University of Illinois web site measuringworth.com and the Hoc 2017 values for comparison purposes. The totals of 275,449 and 198,410 respectively for the totals show a marked difference of £77,039 million due to the method of correcting the results.
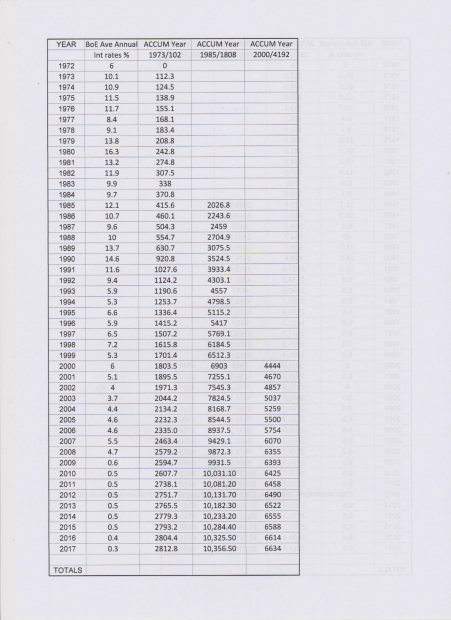
6.5 In order to check these values APP 6.4 shows the calculation of three results from the years 1973, 1985 and 2000 corrected to 2017 values using the Bank of England (BoE) average interest rates for the years from 1973 to 1974 extracted from the Guardian web site, Interest Rates in the UK from 1974 and from 1975 to 2017, extracted from the BoE web site Annual Average Bank rate IUAABEDR.
6.6 APP 6.4 shows that the 1973 net budgetary payment of £102 million in 1973 would be worth £2.813 billion in 2017 based on the interest rates from 1973 to 2017. The University of Illinois (UoI) figure is £2.538 billion and the HoC corrected figure, (see Table 3, APP 6.2) is just £1.038 billion.
Similarly for 1985, the actual cash payment of £1.808 billion is corrected to £10.356 billion, by the use of the interest rate method and to £8.68 billion by the UoI and only £4.379 by the HoC.
For the year 2000, the cash payment of £4.192 billion is corrected to £6.634 billion by the interest rate method, £7.483 billion by the UoI and £5.860 billion by the HoC.
6.7 It can be seen that the UoI figures are much closer to the actual values calculated by using the actual average annual interest rates than the HoC figures which are very much lower. Hence it can be assumed that the UoI calculations are reasonably reliable These calculations do show categorically the relatively high levels of UK budgetary payments to the EU over its 45-year membership.
6.8 Not included in these calculations are the interest charges accruing every year on the budget payments. These annual payments all had to be borrowed as there was always an annual deficit, (apart from a small return from the EU in 1975). Allowing a very modest annual interest rate of 2.5% from 1973 to 2017 increases the current total cost to the UK of its EU budgetary payments to over £285 billion. The current annual interest on this amount at 2.5% is £7.1 billion and this must still be paid for years after BREXIT until the UK’s national debt, currently well over £2 trillion, is paid off!
6.9 As we are looking at the total costs of being in the EU from 1973 to 2021 the annual nett budgetary figures from 1973 to 2021 are re-calculated to 2021 levels in Appendix 6.5. This shows that the total current cost of the UK’s budget payments to the EU from 1973 to2021 was £310,523 billion, or 13.7% of the UK’s current national debt of nearly £2.5 trillion.
APPENDIX 6.1 ANNUAL NET CONTRIBUTIONS TO EU BUDGETS
APPENDIX 6.2 UK NET CASH CONTRIBUTION TO EU BUDGET 1973 to 2017
APPENDIX 6.3 UK NET BUDGET PAYMENTS,1973 to 2017, USING UNIV OF ILLINOIS AND HoC CORRECTIONS TO 2017 VALUES (£ millions)
APPENDIX 6.4 UK BUDGET PAYMENTS COMPARISON USING BANK of ENGLAND AVERAGE ANNUAL INTEREST RATES
APPENDIX 6.5 UK BUDGET PAYMENTS 1973 to 2021 CORRECTED TO 2021 VALUES
| YEAR | Net Cont from | 2021 | ACCUM | Net Cont 2017 | ACCUM | |
| Table 2 | U of Illinois | Table 3 | ||||
| 1972 | 0 | 0 | 0 | 0 | ||
| 1973 | 102 | 2893 | 2893 | 1038 | 1038 | |
| 1974 | 31 | 776.2 | 3669.2 | 272 | 1310 | |
| 1975 | -56 | -1129 | 2540.2 | -390 | 920 | |
| 1976 | 167 | 2829 | 5369.2 | 1006 | 1926 | |
| 1977 | 369 | 5360 | 10729.2 | 1952 | 3878 | |
| 1978 | 822 | 10,250 | 20979.2 | 3897 | 7757 | |
| 1979 | 947 | 9947 | 30926.2 | 3919 | 11676 | |
| 1980 | 706 | 6286 | 37212.2 | 2429 | 14105 | |
| 1981 | 397 | 3176 | 40388 | 1216 | 15321 | |
| 1982 | 606 | 4402 | 44790 | 1720 | 17041 | |
| 1983 | 647 | 4273 | 49063 | 1739 | 18780 | |
| 1984 | 656 | 4028 | 53097 | 1677 | 20457 | |
| 1985 | 1808 | 10,110 | 63207 | 4379 | 24836 | |
| 1986 | 572 | 2969 | 66170 | 1325 | 26161 | |
| 1987 | 1721 | 8036 | 74206 | 3785 | 29946 | |
| 1988 | 1362 | 5676 | 79882 | 2829 | 32775 | |
| 1989 | 2315 | 8720 | 88602 | 4464 | 37239 | |
| 1990 | 2475 | 8561 | 97163 | 4418 | 41657 | |
| 1991 | 544 | 1783 | 98946 | 912 | 42569 | |
| 1992 | 2030 | 6423 | 105369 | 3299 | 45868 | |
| 1993 | 2155 | 6467 | 111836 | 3413 | 49281 | |
| 1994 | 2211 | 6307 | 118143 | 3460 | 52741 | |
| 1995 | 4017 | 10910 | 129053 | 6140 | 58881 | |
| 1996 | 2348 | 5971 | 135024 | 3449 | 62330 | |
| 1997 | 1597 | 3885 | 138909 | 2323 | 64653 | |
| 1998 | 4597 | 10670 | 149579 | 6611 | 71264 | |
| 1999 | 3638 | 8090 | 157669 | 5188 | 76452 | |
| 2000 | 4192 | 8842 | 166511 | 5860 | 82312 | |
| 2001 | 1389 | 2818 | 169329 | 1924 | 84236 | |
| 2002 | 3139 | 6110 | 175439 | 4254 | 88490 | |
| 2003 | 3679 | 6766 | 182205 | 4869 | 93359 | |
| 2004 | 3008 | 5269 | 187474 | 3884 | 97243 | |
| 2005 | 3582 | 5930 | 193404 | 4505 | 101748 | |
| 2006 | 3909 | 6133 | 199537 | 4774 | 106522 | |
| 2007 | 4601 | 6867 | 206404 | 5479 | 112001 | |
| 2008 | 3294 | 4774 | 211178 | 3814 | 115815 | |
| 2009 | 4336 | 6452 | 217630 | 4944 | 120759 | |
| 2010 | 7382 | 10610 | 228240 | 8288 | 129047 | |
| 2011 | 8082 | 11220 | 239460 | 8896 | 137943 | |
| 2012 | 8467 | 11400 | 250860 | 9177 | 147120 | |
| 2013 | 10465 | 13520 | 264380 | 11131 | 158251 | |
| 2014 | 9779 | 12080 | 276460 | 10224 | 168475 | |
| 2015 | 10,763 | 12890 | 289350 | 11202 | 179677 | |
| 2016 | 9626 | 11060 | 300410 | 9824 | 189501 | |
| 2017 | 8909 | 9843 | 310253 | 8909 | 198410 | |
| 2018 | ||||||
| 2019 | ||||||
| 2020 | ||||||
| 2021 | 342800 | |||||
| TOTALS | 147,330 | 342,800 | 275,450 | 198410 | ||
7 COST OF LOST FISHING RIGHTS £100 to £150 BILLION
The EEC produced at the last minute the infamous demand that UK territorial waters and its fisheries were an EEC “asset” to be administered by the EEC as a condition of entry.
Ted Heath swallowed this infamous demand virtually without a murmur, but even he was apparently apprehensive as to the large cost of the budgetary payments to the UK. To soften the blow and make it more publicly acceptable the EEC agreed to a 7year “softening up” period of the total annual cost of UK budgetary payments.
In addition, cabinet papers revealed that on the territorial waters issue that Ted Heath, Conservative Prime Minister said words to the effect that he was “not bothered about the livelihoods of a few Scottish fishermen” if that was the price of joining the EEC! Note that the loss of UK fishing rights to the EEC/EU was apparently estimated to be costing the UK economy £2/3 billion/annum. Hence the total cost to the UK of the loss of UK fishing rights is well over £100 to £150 billion.
8 CURRENT LIABILITY OF BEING IN THE EU UP TO £441+ BILLION
In the Executive Summary of his report, “Why the Eurozone’s fate makes an immediate exit vital” published by Global Britain, Bob Lyddon, of Lyddon Consulting Services Ltd., states that:
“Three years after the UK voted to leave the European Union all we have on the table is a Withdrawal Agreement and a Political Declaration that fail to end the UK’s huge contingent liabilities to the EU’s financial institutions. We do not, for example, cease to be a shareholder in the European Central Bank and the European Investment Bank for at least twenty years.
During the transition period the EU could cause the UK’s maximum contingent liability to rise from the current figure of €207 billion to €441 billion, or by even more if our exit is drawn out into the period of the next EU Multiannual Financial Framework.
Any payment the UK might make for our supposed residual liabilities will be spent immediately on other things: who will then meet those liabilities when they fall due for payment? This all derives from near-criminal irresponsibility by the UK’s negotiators.
For the UK the timing and terms of our withdrawal are vital: can we crystallise and then discharge our liabilities by leaving the EU completely and soon, or do we risk becoming a loss-sharing party as and when the Eurozone financial system goes off its cliff?
This will occur at the latest in 2021 when financial markets belatedly realise that compliance with the EU Fiscal Stability Treaty is unattainable: the Debt-to-GDP ratios of Italy, Belgium, France, Cyprus, Greece and Portugal are all above 95% and only Greece has a current budget surplus.
Compliance is impossible from both an economic and political point of view.”
EXTRA FUTURE COSTS ON RE-JOINING THE EU
9 SUPPORTING COST OF EU PENSIONS OF WELL OVER 30 TRILLION EUROS
9.1 There is a massive “hole” looming in the pension funding for the next generation of workers in many EU countries according to a study commissioned by the European Central Bank. The 18 EU countries in the report compiled by the Research Centre for Generational Contracts at Freiburg University in 2009 showed that the largest pension liabilities in per cent of GDP can be found in France (362.2), Poland (361.1) and Austria (359.9), followed by Germany (329.6) and Italy (323.1). The lowest liabilities have been calculated for Lithuania (179.9) and Latvia (124.8) followed by the United Kingdom (91.2) authors Christoph Mueller, Bernd Raffelhueschen and Olaf Weddige said in the report.
9.2 The UK had one of the lowest pension rates in the EU and the lowest pension liability of those examined at 91.2% of GDP. Despite this the UK pensionable age for men is likely to rise to 68 in a few years. What does that say about the pension prospects for countries like France, Poland, Austria and Germany with pension liabilities which are over 3 times their GDP?
9.3 Furthermore it should be noted that:
a) Only 18 EU countries were analysed in this report leaving the pension liabilities of the remainder unaccounted for.
b) All of the remaining EU countries are net beneficiaries from the EU budget c) At present there are about 4 people working for every pensioner in the UK. In the next 25 years or so this figure is expected to drop to two workers for every pensioner, thus doubling their commitment.
10 COSTS OF UK CONVERTING TO THE EURO £53 BILLION?
Tony Blair was very keen to adopt the euro when he was PM. In 2005 he said that it would probably be around 2010 before the economic conditions were right. Around that time, it was estimated that changing over to the euro as our main currency would cost, (from memory) the country about £32 billion. There have not been any recent calculations as to the cost of the change-over, even for Scotland, where Nichola Sturgeon is continually whingeing about joining the EU. However, even if there were no increased costs today in changing-over converting £32 billion in 2005 to 2021 values raises the current cost to £53 billion.
11 SUPPORTING THE COST OF BANKRUPT EU NATIONS
After years of cheap lending money many EU nations built up huge debts (as did the UK). There is no doubt that if the UK re-joined the EU, it would be drawn into supporting many EU nations with debts which they cannot repay. For example, the debt to GDP ratio of many EU countries in January 2022, Q1, was as follows:
- 1. Greece: 206.0
- 2. Italy: 156.0
- 3. Portugal: 134.0
- 4. Spain: 120.0
- 5. Cyprus: 118.0
- 6. France: 116.0
- 7. Belgium: 114.0
- 8. Croatia: 88.7
- 9. Austria: 83.9
- 10. Slovenia: 80.8
- 11. Hungary: 80.4
- 12. Germany: 69.8
- 13. Finland: 69.2
- 14. Slovakia: 60.6
- 15. Ireland: 59.5
A high debt-to-GDP ratio is undesirable for a country, as a higher ratio indicates a higher risk of default. In a study conducted by the World Bank, a ratio that exceeds 77% for an extended period of time may result in an adverse impact on economic growth. A study by the World Bank found that countries whose debt-to-GDP ratios exceed 77% for prolonged periods experience significant slowdowns in economic growth. Pointedly, every percentage point of debt above this level costs countries 0.017 percentage points in economic growth. This phenomenon is even more pronounced in emerging markets, where each additional percentage point of debt over 64% annually slows growth by 0.02%.
The UK’s debt in 2022 Q1 was 99.6% of GDP, which is high by accepted standards but a lot lower than many EU countries. However, the UK has never failed to repay its debts.
12 ADVANTAGES OF BEING IN THE EU
Clearly there are NO financial advantages to being in the EU as the costs involved are horrendous and there are definitely NO financial benefits to the UK’s citizens, householders and taxpayers.
However, as pointed out earlier, there are some financial benefits to the UK’s big businesses which trade with the EU. Due to being in the EU’s single market the UK could export goods to the EU with no tariffs. Again, this so called “advantage” was a big, big, disadvantage to UK taxpayers and consumers as the loss of income to the UK treasury was far greater due to the enormous negative trade gap in the UK’s trade with the EU. Thanks largely to the EU controlling all the UK’s trade. In addition, UK big business could employ armies of lobbyists to try and influence EU decisions in their favour. They could also better afford staff to ensure compliance with EU bureaucracy thereby denying smaller companies getting business for their products.
In addition, the freedom of movement within the EU, is often cited as a big advantage by EU fanatics in the UK. Unfortunately, this entails freedom of all the citizens of the EU coming to the UK as well. All 447 million of them! This includes all the criminal scum in Europe, who can come and live in the UK, be guaranteed housing, NHS facilities, schooling, benefits etc., etc., and were never in danger of being deported after being prosecuted and found guilty of their crimes in UK courts.
The usual arguments for staying in the EU are therefore pathetic and feeble. Such as, “I do not have to show my passport when travelling in Europe”, and “I can go and live in Europe”.
Also, Lord Adonis has said that being in the EU we can benefit from their laws. Does he not realise that there are 650 MP’s who are supposed to be making laws, for the UK, which benefit the UK? A process which he as a Member of the House of Lords is party to.
COMMENTS
Even before the UK joined the EU it was made clear that the UK was going to be severely and wilfully penalised in order to favour the other EEC countries. Peter Shore, ex Labour Minister, pointed out in his book “Separate Way’s” their intentions. One would have thought that after all the enormous costs in bloodshed, destruction and finance that the UK and its Commonwealth suffered to save Europe from German and Nazi domination during two world wars, the EEC would at least ensure a fair system for the UK’s entry.
“The EEC also produced at the last minute the infamous demand that UK territorial waters and its fisheries were an EEC “asset” to be administered by the EEC. A new imposition not planted on any other nation on joining, before or since.”
NOT ON YOUR LIFE!
The EEC changed the budget contribution procedure from that based on a % of GDP to a system based on taxes based on import duties. As Peter Shore pointed out this was clearly introduced to punish the UK as the UK imported far more of its food than the other, mainly agricultural EEC countries.
The EEC also produced at the last minute the infamous demand that UK territorial waters and its fisheries were an EEC “asset” to be administered by the EEC. A new imposition not planted on any other nation on joining, before or since. Hence the EEC/EU was determined to screw the UK for all they worth right from the start.
Therefore, WHY anybody thinks that being in the EU would be to the UK’s advantage proves how delusional they were, and still are, as history underlines the fact that the UK has been screwed by the EU at every opportunity. Unfortunately, for some inexplicable reason they were assiduously assisted in this by every prime minister and many LibLabCon party politicians since before we joined and for as long as we were in the EU. However, a clue as to why they were so keen to remain and even re-join the EU could be found in the following reference.
Alan Skeds paper (See Ref 12.1 below) says that the Conservative Party under Heath became a secret corporate member of Monnet’s Action Committee for a United States of Europe. The initial fee was £15,000, (equivalent to nearly half a million pounds today). According to Monnet’s chief aide and biographer, Francois Duchêne, the Labour and Liberal parties joined later.
So, it can be assumed that the LibLabCon parties have ALL been aiming to make the UK a vassal state of the United States of Europe for over 45 years and have allegedly been totally and secretly committed to:
• Abolishing the United Kingdom as a sovereign, democratic and independent country. • Abolishing of the monarchy as our Head of State.
• Abolishing Westminster, the “Mother of Parliaments” as the governing body of the UK. • Abolishing the right of UK citizens to “hire and fire” their government and therefore disenfranchising them.
• Abolishing the right of UK citizens to call themselves, English etc.
• Abolishing the UK armed forces and expecting the defence of the realm to be delegated to EU forces.
• Abolishing the UK’s membership of the Commonwealth
• Abolishing the UK’s right to formulate its own foreign and domestic policies. • Giving over 350 million foreigners the legal right to come and live in the UK with no controls whatsoever on how many chose to do so.
• Giving away vast amounts of UK taxpayers money to foreign agencies with little or no control over the amounts demanded.
• Giving away the UK’s territorial waters and fishing rights to the EU.
It is totally unforgiveable that Ted Heath, Conservative Prime Minister, 1970 to 1974, blatantly and deliberately lied to the UK public that joining the EEC would NOT involve any loss of sovereignty, when he had either ALREADY joined Monnet’s Action Committee for a United States of Europe or was just about to. This obviously involved a total loss of sovereignty if it was achieved, which was obviously his intention. I believe that every PM since then, including Blair, John Major, Theresa May, and many MP’s have allegedly been working towards the aim of abolishing our country as an independent sovereign and democratic nation by making the UK a vassal state of the EU. Significantly, attempts to discover whether or not the Conservative, Labour and Lib Dem parties are still in the successor to Monnet’s Action Committee for a United States of Europe have failed as there was no response from the Cabinet Office to this question!
But none of the LibLabCon parties have ever mentioned any of the above aims in any of their manifestos in any general election before, or even during, the whole time we have been in the EU. Nor have any of their treasonous policies, listed above, ever been mentioned in any of the
Queen’s speeches on the opening of parliament. Incredibly, despite thousands of new MP’s being elected to Parliament since 1973, never has any one of them ever made it clear to the public the real alleged intention of their parties staying in the EU, i.e. to effectively disenfranchise the British public and destroy the UK as an independent, sovereign and democratic state and make the UK a vassal state of the United States of Europe. The story of the lies and deceit over the EU by the LibLabCon parties is detailed in Booker and North’s book, “The Great Deception” see Ref 12.2.
It is crystal clear that the Conservative, Labour and Lib Dem parties not only publish pledges in their election manifestos which they fail to honour, they also more insidiously have allegedly NOT declared their secret mission to turn the UK into a vassal state of the EU.
Hence, all three parties have allegedly lied to and deceived the UK public for over 45 years with regard to making the UK a vassal state of the EU and so the question must be asked:
ARE THEY FIT FOR PURPOSE?
Ref 12.1 Global Britain published paper written by Prof Alan Sked titled “TIME FOR A CHANGE, British Conservatism and the politics of Brexit”
Ref 12.2 “The Great Deception” by Booker and North, published by continuum.
9 CONCLUSION
The current political party system is therefore totally corrupt and deceitful and must be swept away and replaced by a system where truth and honesty prevail.