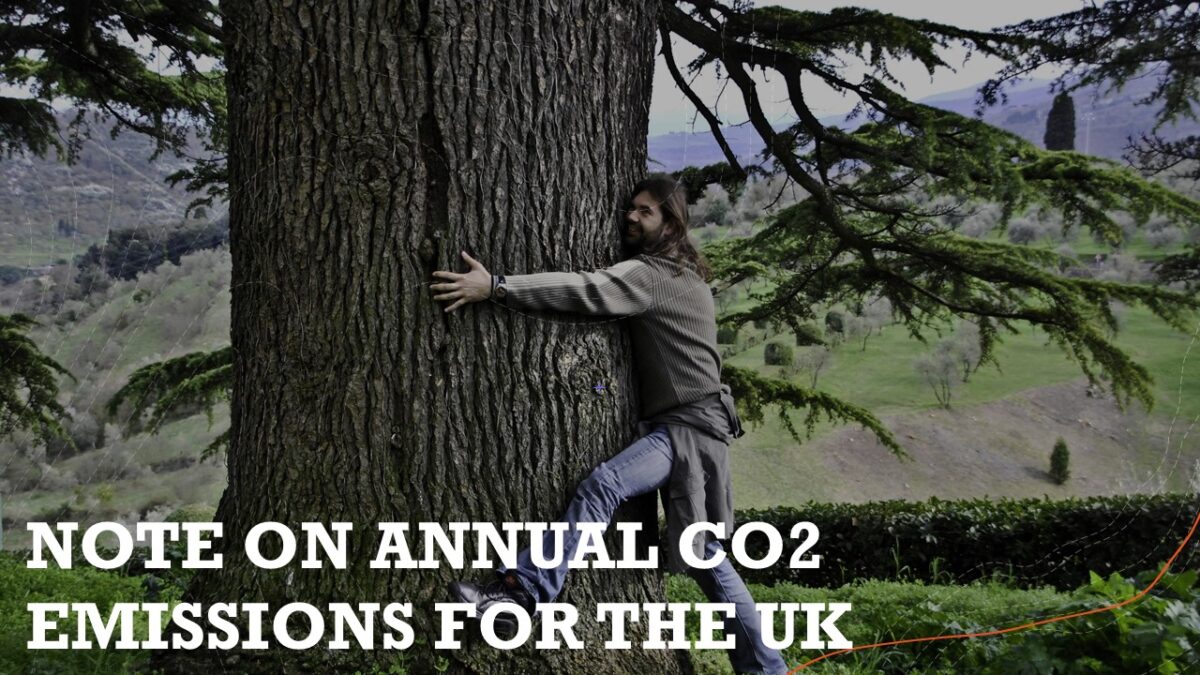

Jerry Wraith writes notes on annual CO2 emissions for the UK.
“the UK’s insane drive to achieve net zero must be abandoned forthwith, as it is ruining the UK economy at a cost of £trillions, for virtually no effect at all”
SUMMARY
The average annual global increase of CO2 emissions from 2017 to 2022 was 2.4 ppm (parts/million)
The human element of that was allegedly 3%, or 0.072 ppm/annum
The UK’s contribution, assumed to be at a further 1%, is then 0.00072 ppm/annum
A global, (i.e. natural and human) rise in CO2 of 180 ppm from the current level of 420ppm to 600 ppm results in a temperature difference of only 0.396°C, and it will take 75 years for the current global output of CO2 to reach that level at 2.4 ppm/annum, and 190 years to reach 1 ºC.
The human element of that temperature increase is allegedly 3%, so the human contribution to the temperature increase would be 0.012°C over 75 years or 0.00016°C/year
The UK’s contribution at 1% of the total human element would be 0.0000016°C/year
Hence, it will take the global human element 6,250 years to add 1°C
It will take the UK 625,000 years on its own to add 1°C to the global total
The global temperature rise from the pre-industrial level to the present day was only 0.05 °C so claims on the UK for “reparations” due to the “damage” caused by the Industrial Revolution, which are probably much less than 0.015 °C for the total human input are total nonsense and must be vigorously rejected. Also, the UK’s insane drive to achieve net zero must be abandoned forthwith, as it is ruining the UK economy at a cost of £trillions, for virtually no effect at all.
In addition, Roger Arthur, C.Eng., MIEE, MIET, has pointed out many times the total stupidity of relying on wind and solar means due to their unreliability and the cost of having to provide reliable back up supplies from fossil fuel sources. He is also an expert at describing the difficulty of providing the materials, manpower and money required to cope with establishing a net zero environment and has confirmed that the UK does not possess the materials, trained manpower or the money to achieve net zero by 2050.
DISCUSSION
According to Our World in Data (https://ourworldindata.org/co2-and-greenhouse-gas-emissions), in 2023, the worldwide CO2 emission was 37.79 billion tons, while for the UK, it was 305.15 million tons. This is the format always quoted by the powers that be and climate fanatics as it appears to be an enormous figure. It is a big figure, but in terms of the total annual human global amount of CO2 released into the atmosphere of 37.79 billion tons it is infinitesimal. In other words, in 2023, the UK contributed about 0.8% to the worldwide CO2 emission.
However, a much more realistic and useable figure for CO2 emissions, is to quote the global concentration of CO2 in parts/million, (ppm). The Moana Low observatory confirmed that the global CO2 level,
in 2017 was 405 ppm,
in 2022 it was 417 ppm and,
in 2024, about 420 ppm.
This means that the average annual global CO2 increase from 2017 to 2022 was 2.4 ppm, from 2022 to 2024 it was about 1.5 ppm and between 2017 and 2024 it was 2.14 ppm. This hardly shows a massive annual global increase in CO2, rather the reverse! Also, bear in mind that this increase comprises the natural global output plus that of nearly 200 nations of which the human element amount was allegedly only 3% of the global total, or 0.072 ppm/annum. We are therefore talking about extremely small annual increases of CO2 by humans. Although the UK contribution in 2023 was 0.8% of the world total it is assumed to be 1%, for the purposes of this note. This therefore gives the UK’s annual CO2 contribution as 0.00072 ppm/annum.
The figure of 0.00072 ppm is indisputable, but its implications will possibly not mean much to the average man/woman in the street. The main concern about rising CO2 is the mistaken and manufactured belief that increasing CO2 levels by humans are dangerously increasing global temperatures. Hence, we must look at how much increasing CO2 really increases global temperatures.
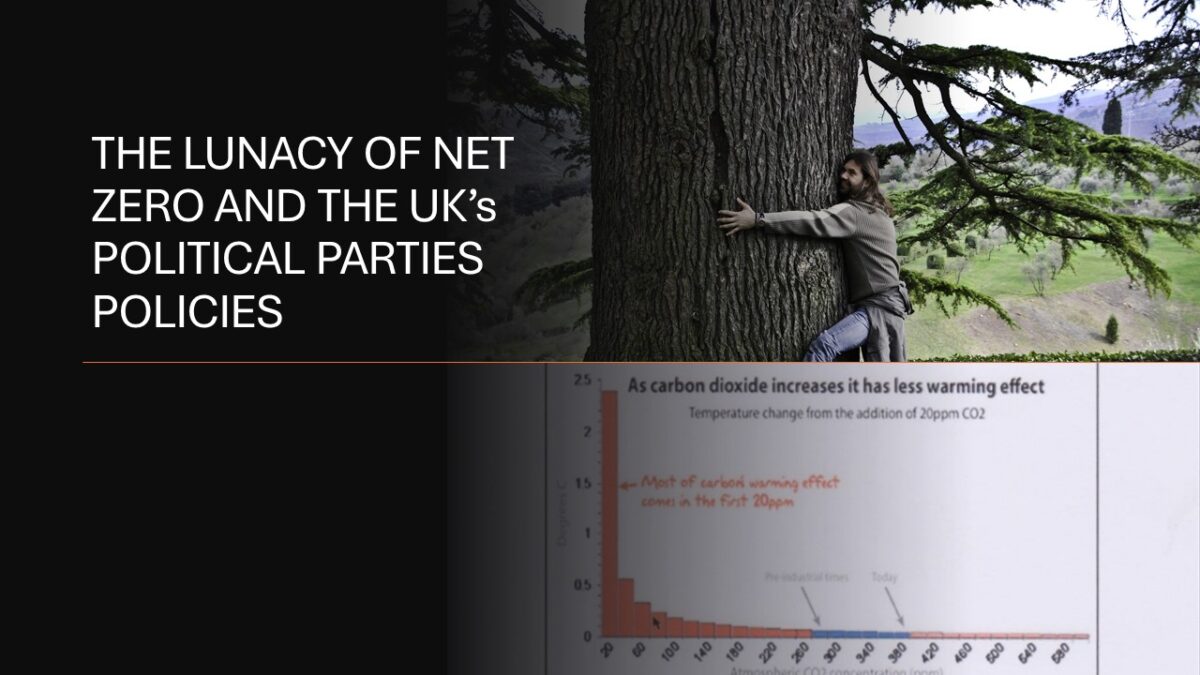
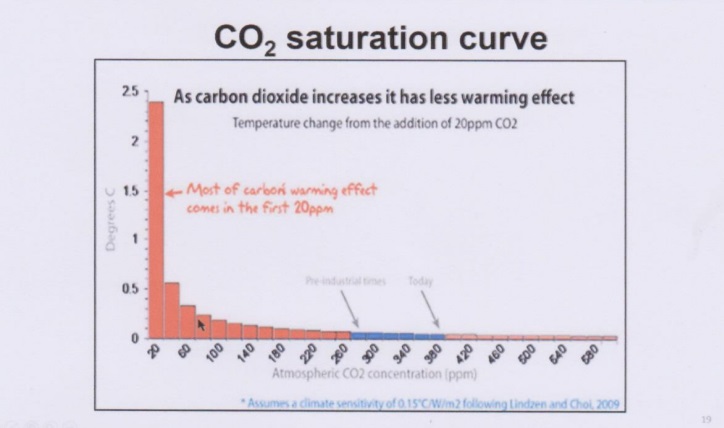
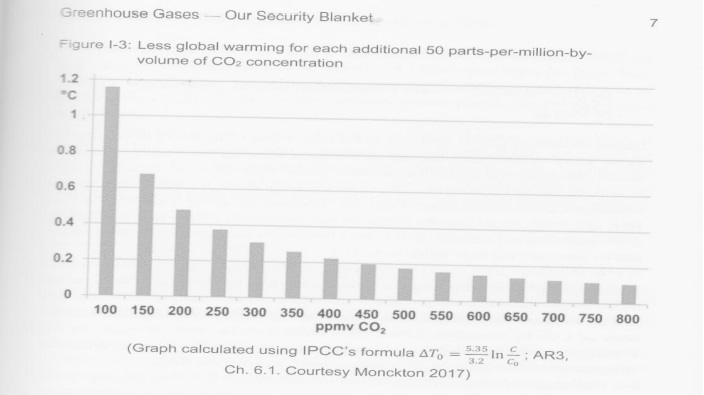
Firstly, it is a proven fact that increasing levels of CO2 have a reduced effect on global warming due to the effects of CO2 saturation. See Professor Happer and Dr van Wijngaarden’s, graph in Figure 1 below.
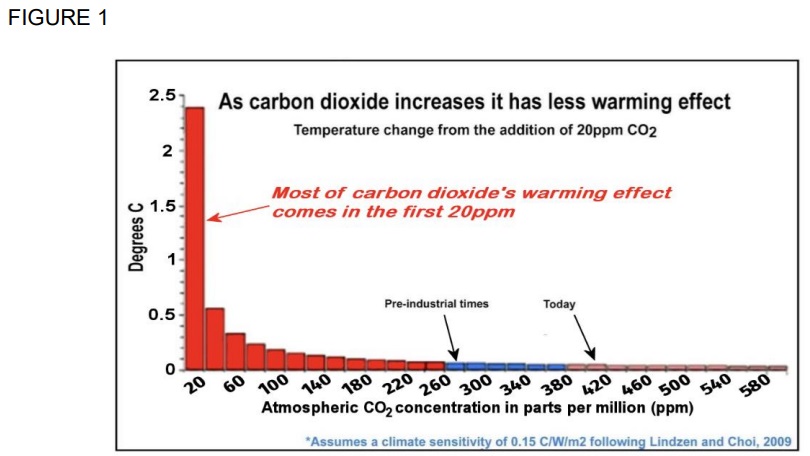
So, what effect on global temperature does the annual human CO2 level of 0.072 ppm and the annual UK contribution of 0.00072 ppm have on global temperature? This is difficult to analyse accurately as Prof. Happer’s graph is not very helpful in this respect as small increases in the CO2 level cannot be easily or accurately established from his graph, particularly as the graph is tending to be asymptotic at higher levels of CO2.
But by expanding the graph and by careful measurements it is possible to establish that the temperature increase at a CO2 level of 420 ppm is 5.2118 °C and the temperature increase at 600 ppm is 5.514 °C.
Therefore, a global rise in CO2 of 180 ppm results in a temperature difference of only 0.396°C, and it will take the global output of CO2 75 years to reach that level at 2.4 ppm/annum, and 190 years to reach 1 ºC.
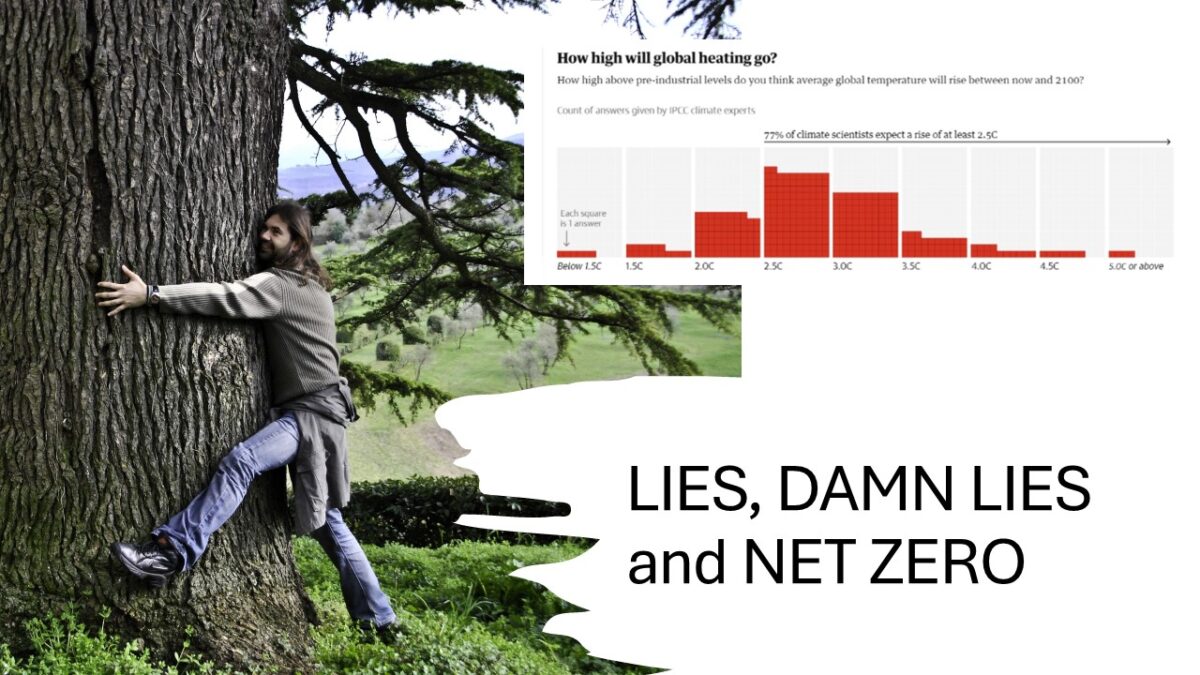
(N.B. Compare that figure with the predictions by 383 out of 843 lead authors of the IPCC’s reports for their estimate of the how much human global warming there would be at the end of the century, i.e. 75 years away! The so-called IPCC’s expert’s answers ranged from 1.5 ºC to 5 ºC. Hardly a “consensus” even within the IPCC!)
“no amount of increasing taxation on aviation, the push to EV’s, heat pumps etc., etc., is going to affect the 97% of annual CO2 produced naturally”
However, the insane rush to net zero can only be concerned with the human production of CO2. Obviously, no amount of increasing taxation on aviation, the push to EV’s, heat pumps etc., etc., is going to affect the 97% of annual CO2 produced naturally. Hence, we need to look carefully at the 3% human level of CO2 produced globally and the UK’s contribution to that total.
Firstly, it must be noted from the graph above that the pre-industrial global CO2 level was 280 ppm. This has increased to about 420 ppm in 2024 a rise of 140 ppm from about 1760 or about 0.54 ppm/year. This rate of increasing CO2 is being used to fuel the panic stricken claims regarding Anthropogenic Global Warming, or AGW, caused by human activity, mainly by the use of fossil fuels.
However, readings off the Happer graph show that the global temperature increase at 260 ppm was 4.614 °C and was 5.118 °C at todays level of 420 ppm. Hence, there was only a 0.504 °C rise in temperature over the 264 years or about 0.002 °C/annum. A 0.5 °C global rise over 264 years hardly counts as a catastrophe especially as the human element was probably much lower than the 3% currently assumed. Hence, claims on the UK for “reparations” due to the damage caused by the Industrial Revolution, which are probably much less than 0.015 °C for the total global human input are total nonsense and must be rejected.
More recently, the Moana Low observatory readings show that the temp increase at 600 ppm is about 5.514 ºC and 5.115 ºC at today’s 420 ppm. This gives us a temperature rise of 0.399 ºC for a 180 ppm increase of CO2. Hence, the human element of this amounts to 0.012 ºC. This therefore means that the global push to achieve net zero will, over 75 years, only reduce global temperature by a maximum of 0.012 ºC at an annual rate of 0.00016 ºC. At this rate it will take 6,250 years for the current global output to increase global temperature by 1 ºC. Hence,
THERE IS NO CLIMATE CRISIS!
“the UK’s contribution to the so-called “global warming” and the “climate crisis” is clearly an even more trivial addition to a trivial global amount”
The UK contribution at 1% of the annual global human output would be 0.00012 ºC and it would take the UK more than 625,000 years to add 1 ºC to the global total on its own. Thus, the UK’s contribution to the so-called “global warming” and the “climate crisis” is clearly an even more trivial addition to a trivial global amount.
Hence, a CO2 concentration rise to 460 ppm from 280 ppm has little effect, (i.e. less than 0.5 °C) on the world’s so-called global warming. In addition, Happer’s graph shows that there will be a negligible effect on global warming if the CO2 level increases to 600 ppm, the extremity of his graph. It will take the world as a whole (600 – 420) ÷ 2.4 ppm/annum = 75 years to reach 600 ppm at an annual increase of 2.4 ppm. This again confirms that there is NO immediate crisis concerning rising CO2 levels.
Furthermore, if the global level does reach 600 ppm this will be highly beneficial to the world’s population due to its beneficial effect on increasing world food production.
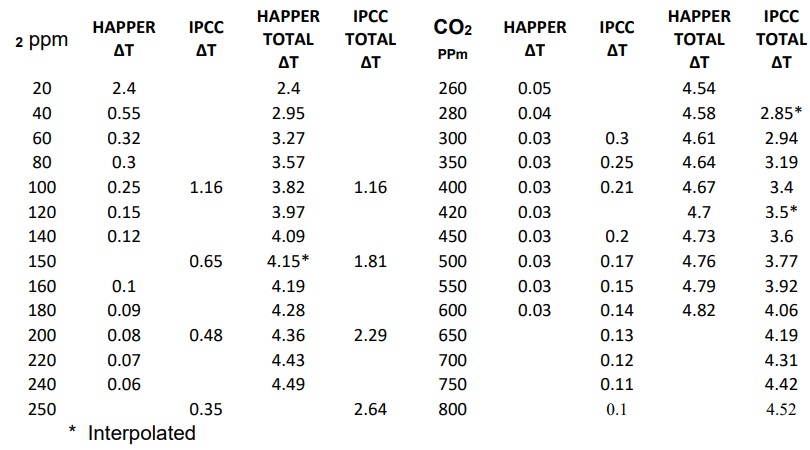
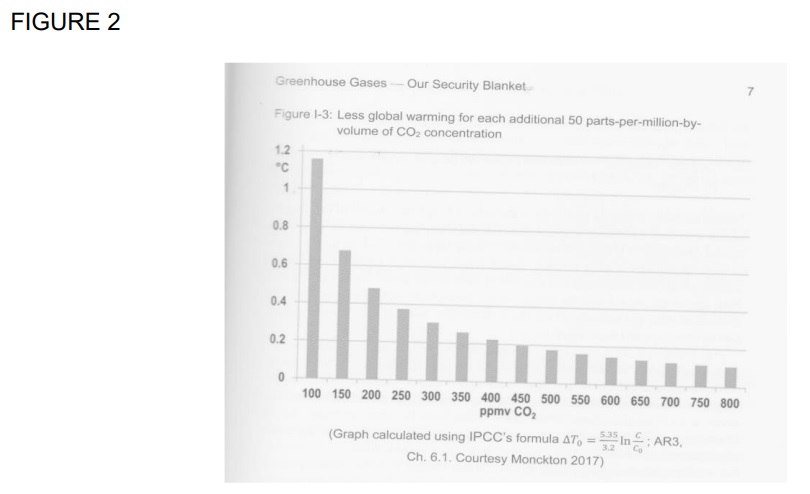
The above analysis has been based on Prof.Happer and Dr van Wijngaarden’s graph. It is interesting to note that their results are confirmed in principle by the IPCC as shown in FIGURE 2 below. This is based on IPCC published information defining the effect on global temperature with increasing CO2. This graph is copied from Gregory Wrightstone’s excellent book, “Inconvenient Facts, The science Al Gore does not want you to know”, as it confirms the shape of the H&vW graph in Figure 1 above. However, it appears from the graph that it gives higher temperature’s than the H&vW graph. Hence, an independent technical assessment of both systems must be carried out which is backed up by test results. It is not feasible to do a comparison between the two graphs at this stage as the IPCC graph starts at 100 ppm and lower concentrations are likely to give much higher results for the temperature increase.
“China emits more CO2 in 11 days than the UK does in a year. There is no point in “leading” if other big emitters are NOT following”
COMMENTS
I am indebted to Roger Arthur, C.Eng., MIEE, MIET, for the following comments. He has over 30 years Power Systems experience, including the design and commissioning of large power projects around the globe and has repeatedly pointed out the risks of continuing along the net zero path. This increases the risk of power cuts, while leaving the UK over dependent on Wind and Solar which produce negligible power for days in a row – all of which, including gas, are more expensive in £ per TWh of energy delivered, than are SMR (Small Modular Reactors), which can be made in the UK.
Apart from building SMRs to carry the UK grid base load (of around 25GW) which cannot be carried by those farms, we need to stop subsidising solar and offshore wind farms now, to utilise our own energy resources and to increase our gas storage from 12 days, to at least 50 days. At present we would be quickly brought to our knees in the event of war.
He also points out that China emits more CO2 in 11 days than the UK does in a year. There is no point in “leading” if other big emitters are NOT following but are taking over our manufacturing base. In any event, it should be clear that the sun is the principal driver of global temperature, to which CO2 is a follower.
Global temperature has risen by around 8°C since the last interglacial trough, which occurred around 20,000 years before the Industrial Revolution. To extrapolate backwards based on around 200 years of history – to validate IPCC models while ignoring factors other than CO2 was naive in the extreme.
Human CO2 emissions fell during lockdowns but the annual increase in atmospheric CO2 went up and it should be clear that the impact of human (never mind UK) emissions is infinitesimal.
Business professionals would not have begun a project like net zero, without a thorough costing and a cost benefit analysis. But the Climate Change Act was put into law, committing millions to misery – without asking them – in a form of taxation without representation. That was gross negligence, and the Act must be repealed as a priority, before even more die from poverty.
Finally, he has confirmed that the UK does not possess the materials, trained manpower or the money to achieve net zero by 2050. The UK’s insane drive to achieve net zero must be abandoned forthwith, as it is ruining the UK economy at a cost of £trillions, for virtually no effect at all.
CONCLUSIONS
1) The UK economy is being decimated and destroyed by the Labour Party, and allegedly fully supported by the Conservative, Lib Dem and Green Parties to give the world an “example” to follow. Unfortunately for us, the rest of the world is not so incredibly stupid as to take any notice, so the UK is well and truly on its own up a blind and destructive dead end!
2) In addition, Roger Arthur, C.Eng., MIEE, MIET, has pointed out many times the total stupidity of relying on wind and solar means due to their unreliability and the cost of having to provide reliable back up supplies from fossil fuel sources. He is also an expert at describing the difficulty of providing the materials, manpower and money required to cope with establishing a net zero environment.
3) Roger Arthur has confirmed that the UK does not possess the materials, trained manpower or the money to achieve net zero by 2050.
4) Hence the UK achieving net zero is blatantly impractical, unachievable, catastrophically expensive and ineffectual and must be abandoned forthwith.
Resume
- Born: 16/08/1938 in Khanspur, NWFP, India
- Education: King Edward VI Grammar School, Southampton
- Northampton College (now City University) BSc in Aeronautical Engineering
- 6 year Engineering Apprenticeship, Vickers Armstrongs A/C Ltd. Southampton, Swindon, Weybridge
- BAe Engineering, Wind Tunnel engineer and Aerodynamics Office
- 4 Years in New Zealand with NZ CAA, Wilson and Gollin and Air New Zealand
- Worked in Westlands Helicopters, Yeovil
- 30 years as a Hovercraft Design Surveyor and then Aircraft Design Surveyor, managing UK certification programmes of new aircraft before acceptance on UK aircraft register.
- Retired 31/08/1998.
- 12 years in the RNR retiring as a Lt Cdr. RNR.
- Married, with two children and three grandchildren.