I have just finished re-reading Christopher Booker’s excellent book titled “The Real Global Warming Emergency”1. This book should be compulsory reading for all politicians and climate change fanatics as it describes from the IPCC’s first report, in 1990, to the Copenhagen conference, in 2009, some of the IPCC’s deceit, lies and manipulation, all aimed at promoting the fallacy that human beings are mainly responsible for catastrophic Anthropogenic Global Warming (AGW)2. The number of professional scientists of international standing who have resigned from IPCC committees due to their adverse views being ignored or deliberately doctored in the final IPCC reports is confirmation of this.
In addition, the publicity of the lies and deceit by the IPCC resulting from the Mann “hockey stick” saga and the “climategate” emails from the discredited University of East Anglia should have also alerted everybody to the total AGW sham being perpetrated on the general public. Also, none of the doomsday predictions concerning AGW have been realised.
Despite all this evidence, the AGW sound bite that 97% of “experts” agree that global warming is mostly man made is still being repeatedly trotted out. This was based on a “review” of abstracts of 11,944 peer reviewed papers published over a 21 year period which supposedly endorsed the scientific consensus on AGW. The 11,944 papers were reviewed later by another group who established that only 0.3% of the papers reviewed actually endorsed man-made global warming as defined in the original review. This result was confirmed when 31,487 American scientists, including 9,029 holding PhD’s, signed the Oregon Petition which disputed the notion of anthropogenic climate alarmism. Unfortunately, U.S. President Barack Obama sent out in 2013, a tweet claiming 97% of climate experts believe global warming is “real, man-made and dangerous.” Apart from being disastrously untrue, the survey he was referring to didn’t even ask that question. So, why was the President of the most powerful nation in the world promulgating such falsehoods?
“He then claimed in a speech to business leaders that the world has only 100 months to act “before the damage caused by global warming becomes irreversible” That was in 2009, 13 years, (156 months) ago. So, why are we still getting snowfalls, cold winters and increasing ice growth in the Antarctic?”
Sadly, even Prince Charles has been guilty of spreading false claims about AGW. In 2005, (17 years ago) he said climate change should be seen as the “greatest challenge to face man” and treated as a much bigger priority in Britain. He then claimed in a speech to business leaders that the world has only 100 months to act “before the damage caused by global warming becomes irreversible” That was in 2009, 13 years, (156 months) ago. So, why are we still getting snowfalls, cold winters and increasing ice growth in the Antarctic? Yet Prince Charles was still banging the AGW drum at the 2022 COP 26 conference in Glasgow. All this coming from a man who talks to his vegetables to help their growth! He should stop making stupid political statements as he is bringing himself and the Monarchy into disrepute.
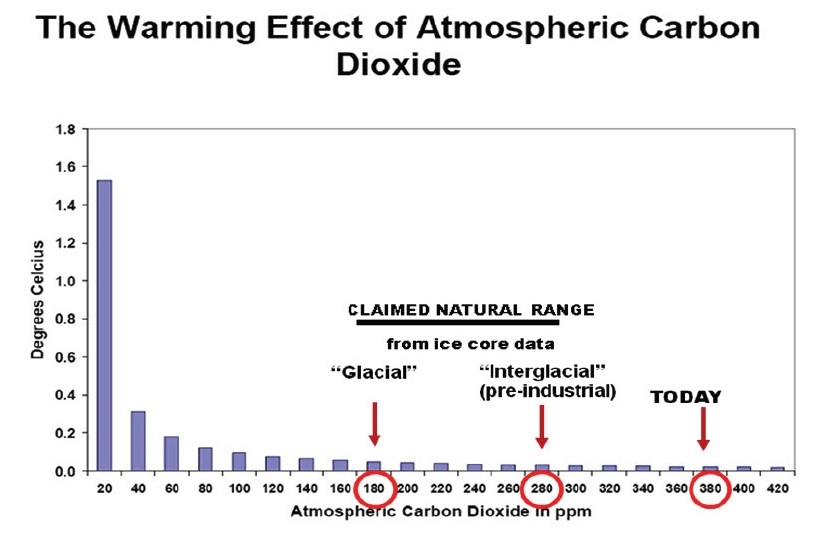
It is also ludicrous to maintain that CO2 is bad for the planet. If it falls below about 150 ppm all plant life will die and all human existence with it. In fact, CO2 levels have in centuries past been 10 times higher than today and if anything, current CO2 levels need to be increased not diminished. Currently, CO2 comprises around 400ppm of the atmosphere, which has been increasing by around 1.5ppm pa for many years. Human emissions contribute around 3% of that annual increase & the UK only emits around 1% of that 3%, i.e., 0.00045ppm pa.
“temperature – not the other way around – and that human CO2 emissions fell dramatically during Lockdown, while CO2 concentration went up. You should also know that increasing CO2 levels result in global greening”
You will be aware that over time atmospheric CO2 concentration follows global temperature – not the other way around – and that human CO2 emissions fell dramatically during Lockdown, while CO2 concentration went up. You should also know that increasing CO2 levels result in global greening, which absorbs CO2 – a feedback loop which doesn’t seem to be factored in IPCC models.
“The RAC estimates that 18 million homes can utilise off-street parking to accommodate EV charging at home. How are the “other” 7 million households going to charge their EV’s?”
Apparently, the wholesale change-over from petrol and diesel engine cars to electrically powered vehicles (EV’s) is essential to achieve the UK’s target of bringing all greenhouse gas emissions to net zero by 2050. However, there are nearly 25 million dwellings in the UK 52% of which are terraced or semi-dets and 21% are flats. The RAC estimates that 18 million homes can utilise off-street parking to accommodate EV charging at home. How are the “other” 7 million households going to charge their EV’s? Has any thought at all been given to the trip hazard for the blind, disabled and elderly of live electric cables draped over the pavements, especially in wet weather?
Apparently, climate change zealots have allegedly said that all “climate deniers” should be prosecuted! I have some sympathy for that argument. However, it is the real climate deniers who should be prosecuted. They are, all those politicians, scientists, media outlets, (particularly the BBC, Sky News and the Guardian), weather forecasters and others who have prostituted their positions, training, careers and common sense to promote the seriously flawed and untrue philosophy of AGW. That is, they refuse to acknowledge that man made CO2 makes an imperceptibly small contribution to global warming. Dr Bruce C Bunker in his book “The Mythology of Global Warming”3 demolishes every claim made by the global warming zealots with facts and figures. He concludes that “the science of global warming is indeed settled”, that is;
“Gas is abundantly available in the UK, so the UK must prioritise gas production, particularly by allowing UK companies to start fracking in earnest”
GLOBAL WARMING IS A MYTH
For the government to swallow all the fallacious hype on climate change, let alone establish government policy on it, is totally insane. The law to achieve net zero must be repealed at once. Even optimistic estimates of the cost of reaching net-zero by 2050 show that it will cost £250 billion4. The government’s action to reduce gas and coal consumption is therefore illogical and insane, as they are the cheapest forms of energy. Gas is abundantly available in the UK, so the UK must prioritise gas production, particularly by allowing UK companies to start fracking in earnest. Coal mines and coal fired power stations must also be prioritised together with nuclear power stations. But new nuclear stations will take some years to become more productive.
As a member of the public I have been able to satisfy myself that AGW is a total sham. The government, with all the resources at its disposal must also be very aware that AGW is a total sham. Yet they persist in promoting this fallacy and are intent on ruining the UK economy in the process for whatever reason known only to them. The UK has already suffered over 50 years of lies and deceit by the Conservative, Labour and Liberal/Lib Dem parties over the EU, so lies and deceit are their stock in trade. They have also lied and deceived us over the so-called global warming for at least 20 years and are intent on making this last at least for another 30 years and decades beyond that. Lying and deceit are these parties’ stock-in-trade. Therefore, they must NEVER be allowed to govern this country again. They are imposing a flawed strategy and an enormous burden on the sovereign people, without their consent and they must be held accountable for that.
References:
“The Real Global Warming Crisis” by Christopher Booker. Quantum Books
“Inconvenient Facts”, By Gregory Wrightstone, Silver Crown Productions, LLC.
“The Mythology of Global Warming”, Climate Change Fiction vs. Scientific Facts by Dr Bruce C. Bunker, PhD, Moonshine Cove Publishing, LLC.
“Paying for Net Zero”, by Tom Sasse, Institute for Government.
As a group that came together to fight a referendum on membership of the EU, we thought we would ask you, what your views are on Net Zero, a possible Referendum, and more generally the environment.
Part 5 in our series of your views. More responses can be found from Part 1.
Thanks to Zack Stiling, and Roald Ribe for their responses.
“it would be arrogant and foolish to suppose that we could arrest a natural and inevitable greenhouse period simply by coercing the public to adopt a lifestyle which blends medieval feudalism with an enforced dependence on smart technology”
Zachary Stiling was the Heritage Party candidate in Kenley in the 2021 by-election, and was on the party’s GLA list the same year. Zachary has been interviewed by us and on our Pubcast.
Is global warming a threat?
No. Glacial and interglacial periods occur naturally across thousands of years and, since we made it through the ice age with little more than basic hand tools, fire and animal skins, we should be quite well equipped to cope with a projected rise of 1.5 degrees centigrade thanks to several millennia of scientific and technological progress. Even if global warming was a threat, it would be arrogant and foolish to suppose that we could arrest a natural and inevitable greenhouse period simply by coercing the public to adopt a lifestyle which blends medieval feudalism with an enforced dependence on smart technology. Presumably, some ‘net zero’ enthusiasts such as Barack Obama and Bill Gates are secretly of the same mind, or they would not both have bought coastal properties within the past year.
Should we have a referendum on enforced Net Zero targets?
No. Few members of the public have a detailed knowledge of climate and there is a danger that the government could increase its fear-mongering to manipulate voters, as the Remain side tried to do with the E.U. referendum. In the event of the government winning such a referendum, it would have a moral imperative of sorts to accelerate its Net Zero authoritarianism.
What action should we be taking on the environment?
The most important environmental action we should be taking is the protection and restoration of our countryside. Other than the fact that the countryside is an invaluable public asset, access to which is a lifeline for many people living in crowded urban areas, the destruction of it leads to phenomena which are immediately attributed to climate change. Before we get carried away with climate, a more immediate cause for loss of biodiversity is habitat destruction; a more immediate cause for flooding is the paving over of green land with impervious materials, which causes excessive surface run-off. We should also make an effort to reduce waste – so much plastic is unnecessary. As far as the climate goes, we should be making use of human ingenuity to adapt, not resorting to fear and authoritarianism in an attempt to control the uncontrollable.
“rational individuals should work for more individual freedom, which is the only action that will unleash the creativity and the economic environment needed to enable all to have enough surplus in their life to care about the environment they live in”
Within the current range of claims made, it is my understanding that no existential threat exists. If the sun were to expand, as it will at some point, that warming would be a threat.
Should we have a referendum on enforced Net Zero targets?
I am against letting any dictator, proletariat, group or majority control and run the lives of each individual. A referendum will not help much given the sense of doom and panic transferred into the population by bias and propaganda.
What action should we be taking on the environment?
The state or collective “we” should not do anything related to hypotheses about the planet’s climate. The “we” of rational individuals should work for more individual freedom, which is the only action that will unleash the creativity and the economic environment needed to enable all to have enough surplus in their life to care about the environment they live in.
This is the fifth set of your responses, further responses can be found from Part 1
As a group that came together to fight a referendum on membership of the EU, we thought we would ask you, what your views are on Net Zero, a possible Referendum, and more generally the environment.
Part 4 in our series of your views. More responses can be found from Part 1.
Thanks to Crispin Williams, Helen Spiby-Vann, and Mike Swadling for their responses.
“I can remember back in the 1960s when the doom-mongers were heralding the start of another ice age! … so I am by nature and experience a sceptic”
I can remember back in the 1960s when the doom-mongers were heralding the start of another ice age! I have also lived through the panics of Aids and the Millennium Bug, both of which were supposed to ruin life as we know it but fizzled out as a major threat, so I am by nature and experience a sceptic. However, I am inclined to believe the graphs that show global temperatures have soared since 1980. Therefore, my proper answer to the question is yes, it is a threat.
1980? Hmm. The temperature rise seems to mirror the rise of industrialisation in China and India. Anyone who has travelled to these and similar countries will have witnessed the high levels of smog and pollution, far worse than we used to have in Britain when we were renowned for our ‘pea-soupers’. In short, we British are not the cause of the problem.
But should we be taking the lead in addressing it? In practical terms, it is a waste of time us ruining our economy to shave off a fraction of the 1% of carbon emissions that we generate. It is well documented that China can – and will – increase their output by this amount in a few weeks, if not days. So it is patently nuts for us to be spending billions of our taxpayers’ money on reducing our miniscule contribution to the problem.
Should we have a referendum on net zero targets?
No. That’s not how we do things in this country. Switzerland can have one as it is part of their democratic processes but there is virtually no precedent here. Referenda should be reserved for constitutional matters only. Anyway, the subject is too emotive and the general public would not be given the full range of facts to make an informed decision.
What action should we be taking on the environment?
Buy lots of sun block, nice shades and swimmies and sod the next generation…
Yes, that was a joke. That said, what we could and should do is pressure the worst polluting countries into reducing their emissions. How? Well, as a suggestion, we could put a ban (or very high tariffs) on imports from them until they address the problem. Of course, this would increase the cost of goods we buy but I suspect the total would be a mere fraction of what we are intending to spend on net zero. And it would stimulate our manufacturing base.
Finally, if we are intent on reducing our emissions, this would best be done through market forces rather than government diktats, artificial target dates and huge subsidies. Once electric cars are cheaper than petrol ones and heat pumps are cheaper than gas boilers, then we will naturally move towards lower emitting technologies.
“Kenya successfully banned plastic packaging in 2017, Rwanda in 2008. We don’t need plastic packaging. We have paper, cardboard, tin, glass, compostable and natural fibres”
‘I’m not going to replace the polyfoam with paper food trays until the government makes me.’ Said the chip-shop man nonchalantly. Not so long ago I got into an uncivilised wrangle over a chip tray. My teenager left the shop in horror at my indiscretion.
However unreasonable and hopeless it may seem, small changes will make a huge difference.
Is global warming a threat?
I believe global warming is a threat. However, as a Christian, my divine calling is unconditional advocacy for compassionate stewardship of the earth’s creatures and plants. Plus to foster equitable sharing of the earth’s resources.
Should we have a referendum on enforced Net Zero targets?
I think this would be a good idea as it will create awareness about the implications across the board. Open discussion and critique from a range of opposing positions will stir hearts into action. Assuming it is approved, it will strengthen the resolve and mandate of this movement. Unfortunately, there is so much ‘greenwashing’ at large, a person can be forgiven for thinking they are helping the planet by buying more plastic Petunias.
What action should we be taking on the environment?
Lifestyles: More cherished, forbearing and Godly. Less materialism, disposable and excess.
Plastic packaging: ‘I was shocked, when I came to the UK, there’s plastic wrappers on everything in the supermarket.’ (Confessions of my Kenyan friend in London).
We don’t need plastic packaging. We have paper, cardboard, tin, glass, compostable and natural fibres that are part of circular economies. Supermarkets are selling more and more items in plastic packaging. This is not acceptable. We can solve the plastic packaging problem simply by not producing it in the first place.
Moreover, we should be extending this to manufacturing by promoting ‘Cradle to Cradle’ type standards: healthy, socially just and authentically sustainable. Producing no waste and using natural energy flows that do not pollute.
Energy: We have been building wind turbines and paying for them to be switched off. There must be a better way to manage our sustainable energy assets so we can phase out fossil fuels.
“we have a situation where the political/media classes all agree they need to lower our standard of living, which I firmly believe people don’t want (note they don’t seem to want to lower theirs)”
Mike Swadling one of the Croydon Constitutionalists.
Is global warming a threat?
Humans are exceptional. 200 years ago Global life expectancy was under 30, today life expectancy in the poorest counties is over 50, the global average is over 70. When I was at school people starved in many countries, today hunger has almost disappeared except where war or governments stop food supplies. Since the turn of the century the expanding economies of China and India mean China has a middle class the size of the population of Europe, with India only a few years behind.
Despite expanding populations and doomsday predictions the number of people dying from extreme weather events continues to collapse. Climate has changed for millennia before mankind, during our existence and will for many more to come without our interference. For over 30 years ‘experts’ on hefty grants have told us of impending doom from global warming, rising seas levels, agricultural failures, and a scorched planet. None of this has happened, and the planet is greening every year.
Is global warming a threat? Maybe, but human ingenuity will not just rise to any challenge, we will excel and overcome it.
Should we have a referendum on enforced Net Zero targets?
All of the major parties are in lockstep on Net Zero. For all of the challenges of a referendum, we have a situation where the political/media classes all agree they need to lower our standard of living, which I firmly believe people don’t want (note they don’t seem to want to lower theirs). Unless or until a party currently outside parliament makes a breakthrough, the people have no real choice. For all of the challenges off a Referendum on Net Zero, today we have the people pitted against parliament, and like Brexit, I can only see that a referendum will allow us to set parliament back on a path of striving to improve rather than diminish our lives.
What action should we be taking on the environment?
We should protect the environment we live in. In our borough, every small patch of land is being built on. New blocks of flats out of character of the area they are built in keep popping up. Council and government policies have made where we live a less pleasant environment, we need to change this.
Globally we should protect at risk species of animal and plant. I believe this is best achieved by balancing the environment concerns and economic concerns of the local populations. Chickens are not at risk of extinction because they are good source of food and economically useful. Horses are often well looked after because they work and are raced, so are economically useful. Dogs are not at risk of extinction because they work and provide companionship. There is no threat of extinction of lawn grass or corn. Whether through tourism, food, work or altruism, animals and plants that are economically viable thrive.
We can best protect the environment by making bio diversity an economic benefit. To achieve this we should focus on raising the standard of living of the poorest across the globe to the point that they have the capacity to choose to invest in, and protect their local environments.
This is the forth set of your responses, further responses can be found from Part 1 and in Part 5.
As a group that came together to fight a referendum on membership of the EU, we thought we would ask you, what your views are on Net Zero, a possible Referendum, and more generally the environment.
Part 2 in our series of your views. More responses can be found in Part 1 and Part 3.
Thanks to Josh L. Ascough, Tam Laird, Georgina Guillem, and Sandy Wallace for their responses.
“We could throw billions at the environmental cause, but if we don’t address the tragedy of the commons we will never improve anything. In order to address the environment, we need the market process”
Libertarian, economics writer Josh L. Ascough has contributed many times to our site. He can be followed on Twitter and be heard on our Podcast from earlier this year.
Is Global Warming a threat? Yes I would argue it is a threat, but doomsday predictions by people desperate to be proven right about humanities demise are useless actors. While we should acknowledge what negative effects pollution has, we must also acknowledge what we have done well.
Should we have a referendum on enforced Net Zero targets? Net Zero no matter the target is an impossible venture, as all choices have trade-offs. It’s in human nature to adapt our environment around us in order to survive, rather than the rest of the animal kingdom which must adapt to its surroundings in order to survive. Because of this nature there will always be negative feedback. So yes, we should have a referendum but we must instead of targeting figure out how to internalise the costs to those who made the trade-offs.
What action should we be taking on the environment? We could throw billions at the environmental cause, but if we don’t address the tragedy of the commons we will never improve anything. In order to address the environment, we need the market process. We should campaign for mass privatisation of all land, allow for the private ownership of seabed’s, do away with subsidies, abolition eminent domain laws, completely privatise rubbish collection & rubbish dumps. As long as we persist in the idea of “common ownership”, & “the public good” through eminent domain laws, we will never incentivise innovation; we will simply spread out the time it takes for costs to be socialised.
“Global warming is and never has been an existential threat. It’s one of the many hobgoblins used by government to justify it’s own incompetence, interference and increasing authoritarianism”
No. Global warming is and never has been an existential threat. It’s one of the many hobgoblins used by government to justify it’s own incompetence, interference and increasing authoritarianism.
Should we have a referendum on enforced Net Zero targets?
The danger of a referendum is that the government might win. Simply strengthening its position. Scientific fact should not be decided by consensus but by reason and empirical evidence. By all means vote out the perpetrators at the next General election.
What action should we be taking on the environment?
Government should concentrate on fostering an environment that encourages human flourishing and wellbeing. The best way it can do that is by leaving us alone. Polluters should be made pay for damages through the courts. Instead of big business and pharma being afforded government protection.
“I do not think Global warming is a threat… The Climate as we call it has been changing and indeed is constantly changing since the beginning of time”
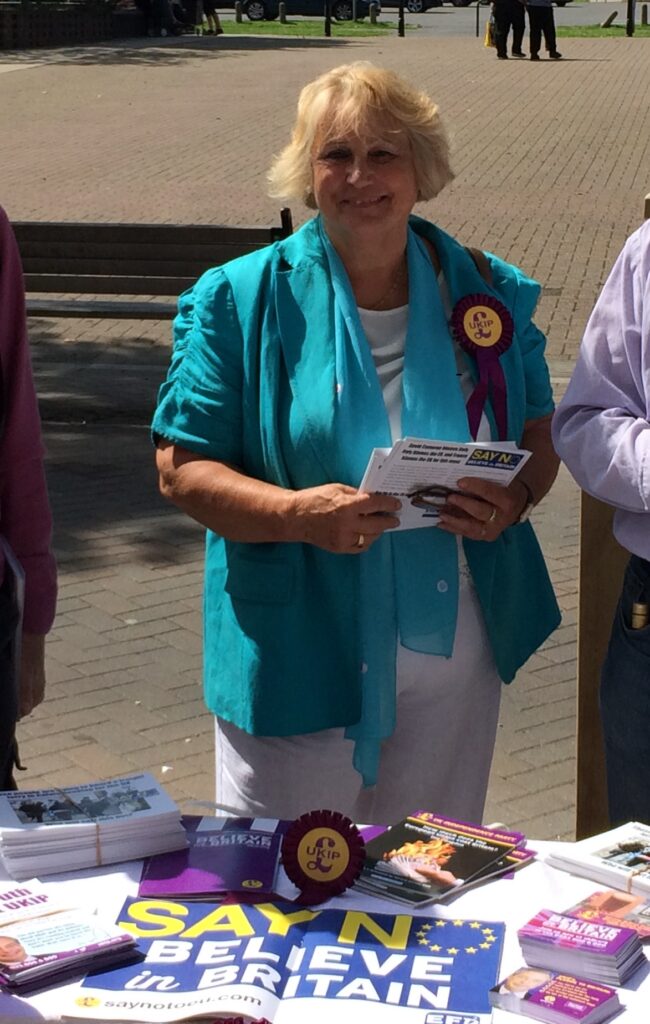
Brexit campaigner Georgina Guillem, is a former UKIP candidate in Purley and has run many street stalls and station leafleting sessions across the borough.
Is global warming a threat?
I do not think Global warming is a threat. I think the climate is so complex a system that we should not meddle with it. The Climate as we call it has been changing and indeed is constantly changing since the beginning of time.
Should we have a referendum on enforced Net Zero targets?
Yes, I do think there should be a referendum on whether we want to spend trillions of pounds on Green Energy to end up with Lukewarm houses in winter.
What action should we be taking on the environment?
I do think though that we as human being owe the planet care and management as to not pollute in the way that we are doing. We must Behave better starting with plastic and throw away packaging, that is sometimes unnecessary.
“There is a close to absolute establishment consensus that the way forward is the imposition of costs and restrictions on liberty upon ordinary people, with predictable exceptions for those who are important enough.”
Life is not that simple, climate change is both a threat and an opportunity, depending on who and where you are, the actions of mankind clearly have an impact, how much is hard to gauge, what effect different actions would have is harder to gauge and certainly not proven and the cost of those actions versus the hoped-for benefit of them is at best marginal if every wish comes true and at worst far worse than the effect of climate change
Should we have a referendum on enforced Net Zero targets?
There is a close to absolute establishment consensus that the way forward is the imposition of costs and restrictions on liberty upon ordinary people, with predictable exceptions for those who are important enough. The only possibility that the establishment row back is if normal politics is disrupted and governments see the possibility of losing power. Calls for a referendum seem to me to be part of that, but there needs to be some sort of political movement emerge to cause Tory MPs, in particular, to fear for their future
What action should we be taking on the environment?
We should be planning for environmental change, not planning how to avoid it. The latter is wholly unproven technology, the latter even with official state opposition across the developed world is wholly proven. Can we terraform Mars? Probably. Can we terraform Earth? Of course we can. Desalinate water, irrigate deserts, plant trees, capture carbon. Deliver nuclear power. Reclaim land. Permit and enable economic migrancy. Mankind needs to believe in itself.
This is the second set of your responses, further responses can be found in Part 1 and Part 3
Reaching Net Zero carbon emissions by 2050 is enshrined in UK Law. With COP26 in Glasgow the news is full of stories about Climate Change and Global Warming. With all the main parties in agreement on the policy we have recently seen calls for the people of Britain to have a choice via a referendum on Net Zero. Nigel Farage has hinted he could campaign, articles have appeared in the Spectator, and Gaia Fawkes sums the position up brilliantly when they say:
“Politicians seem very keen to avoid a Net Zero Referendum. It’s a project without democratic legitimacy. Let the politicians who want us to eat bugs, have cold showers, lukewarm heat pumped houses, higher energy bills and far more expensive foreign holidays, make their case!”
Politicians seem very keen to avoid a Net Zero Referendum. It's a project without democratic legitimacy. Let the politicians who want us to eat bugs, have cold showers, lukewarm heat pumped houses, higher energy bills and far more expensive foreign holidays, make their case!
As a group that came together to fight a referendum on membership of the EU, we thought we would ask you, what your views are on Net Zero, a possible Referendum, and more generally the environment.
Thanks to Peter Sonnex, Jeremy Wraith, Dr Tom Rogers, and Scott Neville for their responses.
“we must allow the developing world their industrial revolution. The world, where energy poverty is no longer a significant factor, will be in a better position to adapt to ever changing climactic conditions”
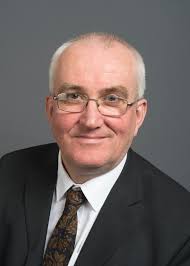
Peter Sonnex, former Brexit Party candidate and political campaigner.
Is global warming a threat?
Global warming may be a threat to the planet, if only we knew! That the climate has always been in flux is true – so what is the ideal status quo or permanent reversal we are trying to engineer? And, at what cost, if our UK 1% contribution may amount to £1 Trillion to mitigate?
Climate and Covid catastrophists are one and the same – doing stuff just in case, if it saves just one ounce of carbon or one life. And, we know the government can’t do cost benefit analysis.
Should we have a referendum on enforced Net Zero targets?
Referenda are only offered when the establishment believes it can win. The Brexit result confirmed both arrogance and a lack of connection to the electorate. Neither the government, nor the opposition, will risk a climate referendum.
What action should we be taking on the environment?
Firstly, we must allow the developing world their industrial revolution. The world, where energy poverty is no longer a significant factor, will be in a better position to adapt to ever changing climactic conditions – perhaps even influence the most extreme effects.
Secondly, I think we should be pursuing nuclear power – capital plants, small modular nuclear reactors and fusion – with more vigour and investment. We should be emulating the example of our sun, not trying to fight against it.
With nuclear power comes the energy to desalinate and move water, ending the reality of water poverty and potential conflict. Hydrogen through electrolysis becomes entirely viable. Hydrogen can be stored, and with fossil fuels provide stored, potential energy and, therefore, energy security.
NO! The REAL threat are the people who think that man made CO2 is causing it and making us all suffer huge costs and inconvenience because of it.
Should we have a referendum on enforced Net Zero targets?
DEFINITELY and ASAP!
What action should we be taking on the environment?
Developing more nuclear power stations and using coal (mined in the UK of course) powered power stations until all our generated power is nuclear.
“We have to be very careful about being panicked or coerced into measures that in themselves would be catastrophic to our industries, economy and human freedoms in response to alarmist claims of a ‘climate emergency’”
The CPA affirms that we have a duty to be the best possible custodians of God’s creation — our planet and its natural resources. We therefore have a developed programme of policies for greening the economy and transport, which you can find in our 2019 Manifesto (www.cpaparty.net).
Our approach to ‘climate change’ is a sensible and cautionary one. We have to be very careful about being panicked or coerced into measures that in themselves would be catastrophic to our industries, economy and human freedoms in response to alarmist claims of a ‘climate emergency’ and ‘climate extinction’. Contrary to the establishment narrative that ‘the science is settled’ (in itself an unscientific statement) the extent to which recent changes in temperatures are unnatural, dangerous to our survival and/or caused by human activity are questions still contested by many scientists, and which require much more open scientific freedom, investigation and debate than is currently being allowed. The earth’s climate after all has never been something static but has always been constantly changing and evolving in the absence of human presence or attempted control.
We would therefore implement effective but proportionate policies best in themselves for the environment and long-term provision for humanity, and not just because they reduce carbon omissions. It is right that we seek to eliminate pollution, continuously improve energy efficiency, increase recycling, and strive to further the use of renewable sources of energy, and we have detailed policies in all these areas which we would support also at a local level.
“you will be going back to the supermarket at some point, the lorry that delivers to the supermarket will go back to the factory, just take the damn bottles back and refill them”
Potentially, it depends on how far it goes and I don’t believe we have sufficiently accurate data to know for sure. The important thing to consider is the word “threat”, is any of this a threat to the planet, no, the planet will be fine regardless. If the planet was going to boil away with a self-reinforcing loop of heating it would have done so millions of years ago. However any change is always a threat to some people (and potentially a benefit to others), so yes global warming or global cooling does pose a threat to some of humanity regardless how big or small. There could however be a big threat to humanity, I personally don’t believe all the doomsday predictions, but I accept I might be wrong, and I accept totalitarian government is a very big threat too.
Should we have a referendum on enforced Net Zero targets?
I am unsure. I don’t believe in enforcing many things is just, because the use of force against another is wrong, holding a referendum does not suddenly make me believe this is ok (as many found the presence of an EU referendum does not make their belief in themselves less European). I simply don’t agree with a tyranny of majority. Any referendum would be fought on religious grounds (the fastest growing religion of “the science”) and that will just lead to far more anger and fighting with everyone becoming more ideologically entrenched rather than trying to examine empirical fact and critically assess information presented.
What action should we be taking on the environment?
Waste is by far the biggest problem, filling up our landscapes with all this scrap, use once and throw away plastics. The debate is so skewed it’s all about paper vs plastic straws rather than “why do most people even need a straw?” or make sure that you put your plastic bottles in the correct bin rather than “you will be going back to the supermarket at some point, the lorry that delivers to the supermarket will go back to the factory, just take the damn bottles back and refill them”. Energy production needs to focus on nuclear, particularly research in nuclear fusion where the UK is already a world leader, bizarrely we don’t say much about our achievements despite our achievement in making Didcot the hottest place in the solar system (briefly) https://www.thetimes.co.uk/article/didcot-was-hottest-place-in-solar-system-gj9wg258f.
You can read more about Scott and the Hampshire Independents in his interview with us, or listen to him one of our recent Podcasts.
This is the first set of your responses, further responses can be found in Part 2
The purpose of these notes is to present some facts about the campaign to stop global warming and climate change. The climate has changed in the past, is probably changing now, and will change in the future. The campaign is trying to stop the unstoppable.
The natural factors affecting global temperature are very powerful: terrestrial, solar, galactic, and cosmic. Although the manmade contribution to CO2 levels in the atmosphere is claimed to be substantial it is actually very very small and the effect on temperature will be minimal.
1: There are 5 organisations which monitor global temperatures:
Terrestrial: GISS Goddard Institute of Space Studies. Part of NASA.; NOAA National Oceanic and Aerospace Administration (USA).; HADCRUT Climatic Research Unit, UK Met Office
Satellite
RSS Remote Sensing Systems, USA.; UAH University of Alabama, Huntsville.
They all produce slightly different figures. The terrestrial ones have been “homogenising” the figures i.e. adjusting the recent temperatures upwards and older data downwards for years. I prefer to use the satellite data which is more reliable.
“Professor Chris Holland of the Hadley Centre for Climate Prediction and Research said: “The data doesn’t matter. We are not basing our recommendations on the data. We are basing them on the climate models.” Such quotes are never mentioned in the news media”
2: Revealing statements from the Intergovernmental Panel on Climate Change (IPCC)
In 2007 the IPCC Assessment Report 4 contained the following statement in the chapter by Working Group 1 : “ The climate system is a coupled non-linear chaotic system and therefore the long term prediction of future climate states is not possible”
And it was further confirmed in 2010 by Ottmar Edenhofer Chairman of the UN – IPCC Working Group 3 who said “ One must say clearly that we redistribute de-facto the world’s wealth by climate policy. One has to free oneself from the illusion that international climate policy is environmental policy. This has almost nothing to do with environmental policy any more”. When it became clear during the temperature pause, 1999 onwards, that the forecasts were not supported by the empirical data, Professor Chris Holland of the Hadley Centre for Climate Prediction and Research said: “The data doesn’t matter. We are not basing our recommendations on the data. We are basing them on the climate models.” Such quotes are never mentioned in the news media.
3: Carbon Dioxide
Carbon Dioxide in the atmosphere has recently been increasing by about 2 molecules per million molecules (00.0002%) per year and now stands at about 410 molecules per 1,000,000 molecules (00.04%). This is expressed as parts per million by volume (ppmv) . I prefer to express it in terms of 10,000 molecules of atmosphere. In 1900 the volume of CO2 in the atmosphere was 3 molecules in 10,000 molecules; in 2020 it was 4 molecules in 10,000; that is an increase of 1 molecule in 10,000 in a period of 120 years and that extra 1 molecule is alleged to have caused the global warming (0.8C). Is the climate of the world so delicately balanced that a change of 1 molecule in 10,000 can cause dangerous global warming? CO2 can warm the atmosphere – but not much. These facts are never mentioned in the news media.
4: The warming effect of CO2 is logarithmically reducing.
This means that as more and more gets into the atmosphere the additional CO2 has less and less effect. As we are now at 410 molecules per million any additional CO2 will have only marginal effect. (see paper by Dr. David Archibald available at http://wattsupwiththat.com/2010/03/08/the-logarithmic-effect-of-carbon-dioxide). As to whether the hypothesis that manmade CO2 is having any significant effect is correct – well you can see that the answer is probably no. This is never reported in the news media.
The point is that any extra CO2 introduced into the atmosphere now will have no effect on global warming. (Archibald,D, 2007)
5: Measurement of CO2.
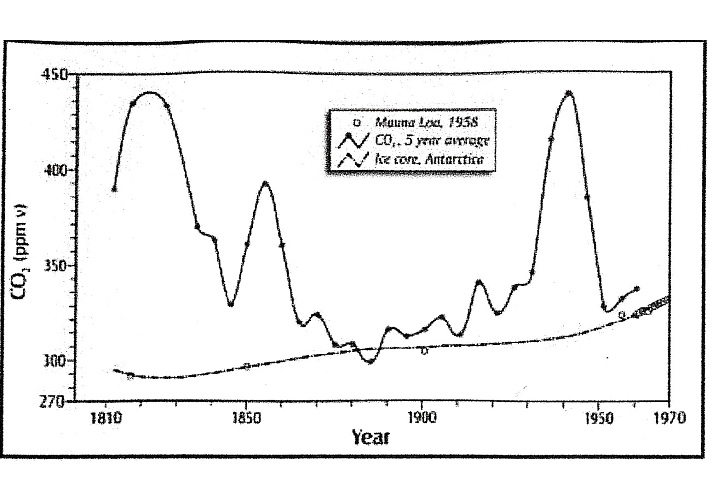
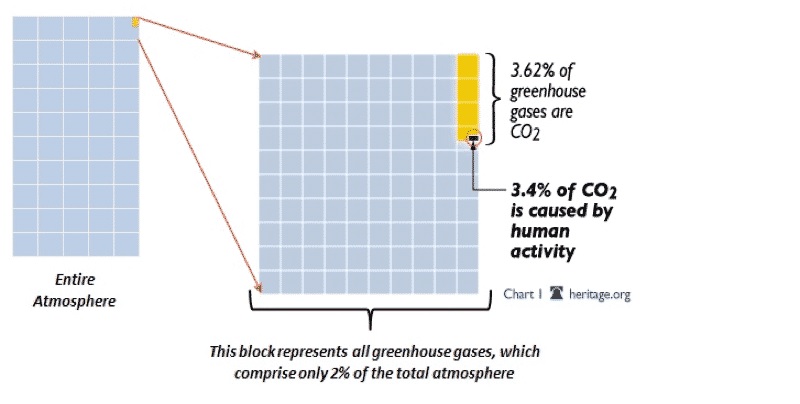
Since 1958 this has been done by the laboratory at Moana Loa, Hawaii using infra-red spectroscopy. Between 1812 and 1961 it was done in various laboratories around the world using the Pettenkofer method. In those 149 years this gave results varying from 270 ppmv to 440ppmv (1. Beck, E. 2007, Energy and Environment 18: p259-282; 2. Plimer, Heaven and Earth p 416). See the graph below. The IPCC have ignored without explanation the thousands of measurements using the Pettenkofer method with the variable results shown below except to take the lowest figure of 270 ppmv as the pre industrial era level which, apparently, is reliable while rejecting the figures of 440 ppmv in 1825 and 1940 as not reliable. Since 1958 the Moana Loa results show a consistent rise of about 2 ppmv per year. The laboratory is situated near the top of one of the largest volcanoes on earth surrounded by the warm Pacific Ocean. Volcanoes emit large quantities of CO2 and warm seas degas large quantities of CO2 also. Professor Ian Plimer states that over 80% of Moana Loa measurements are dismissed as poor data – i.e. non conforming.
Determination of atmospheric CO2 by the Pettenkofer method (solid line of 5 year averages) between 1812 and 1961, deductions of atmospheric CO2 from Antarctic ice core (gas chromatography) and edited measurements of atmospheric CO2 from Mauna Loa (infra-red spectroscopy,1958 and onwards). One method of measurement shows great variability in atmospheric CO2 yet another method does not. The high values of CO2 by the Pettenkofer method have been rejected by the IPCC yet the lowest value is used by the IPCC as the base line pre-industrial value for atmospheric CO2. Graph derived from Professor Plimer’s book “Heaven and Earth” page 420. The diagram below shows CO2 as a proportion of the atmosphere and as a percentage of the greenhouse gases.(Dr. Tim Ball www.technocracy.news.com). 2% x 3.62% x 3.4% = 00.0024%
So forecasting man’s effect on future climate in terms of doubling total CO2 is factually dishonest.
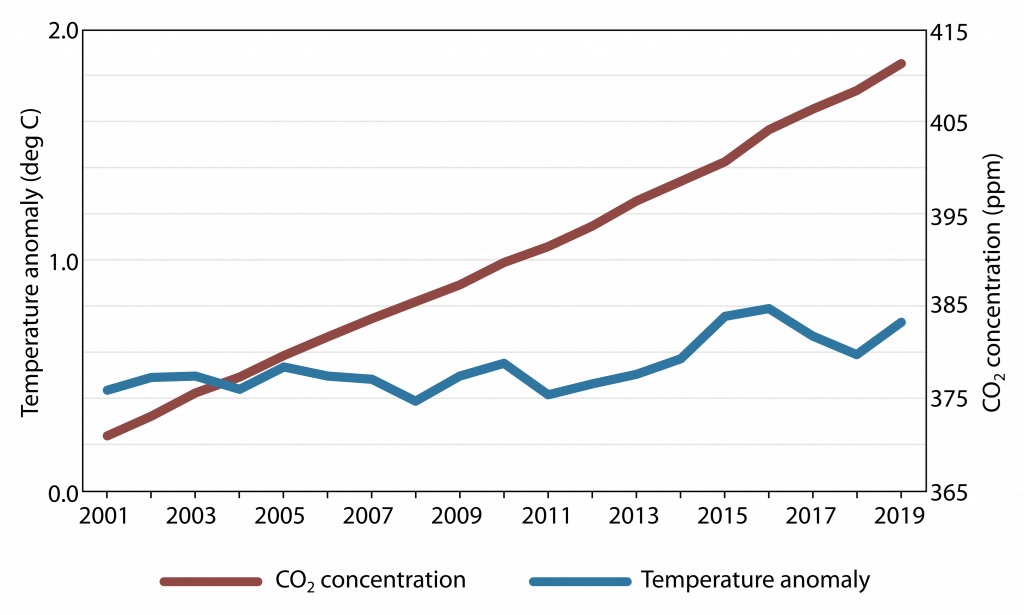
6: Growth in CO2 compared with global temperature
It is interesting to note that the increase in CO2 (derived from NOAA via Moana Loa) shows an increase of 2 parts per million per year.. Compare this with the graph which shows the CO2emissions increase per year in million metric tonnes. This calculated tremendous growth has had no impact on the annual growth measured by NOAA.
7: The life of CO2 in the atmosphere is short
There are 37 scientific papers which have examined the life of CO2 in the atmosphere. In 35 of them the findings varied between 3 years and 7 years. One of them found 25 years (Suess&Lal 1983). One of them found in excess of 100 years. The Intergovernmental Panel on Climate Change (IPCC) chooses to take 100 years . This is never mentioned in the news media.
8: Methane
Methane is widely claimed to be significant in global warming as it is 20 times more effective than CO2. Its volume in the atmosphere is about 1,800 molecules per billion i.e. less than 2 molecules per million. Yes, like CO2 it can warm the atmosphere but not much. What is more, methane quickly and spontaneously oxidises into CO2 and water. (Plimer, “Heaven and Earth” page 183). This is never reported in the news media.
9: Water vapour
Water vapour is the main warming gas and forms 95% of all the warming gases. It is beyond the control of man Water vapour has a substantial warming effect. Interestingly water vapour in the form of clouds has both a warming and a cooling effect simultaneously. The net effect is still in dispute. This is never mentioned in the news media.
10: There is one factor which destroys the CO2 hypothesis
The most fundamental assumption of the hypothesis is that an increase in CO2 will cause an increase in temperature. This assumption is programmed into the computer models and has a compound effect on forecasts. In fact every record for any period of time and duration shows that exactly the opposite happens – temperature increases before CO2. (Professor Tim Ball, Phd. The Corruption of Climate Science, page 162.) This fact is never mentioned by the IPCC or reported in the news media.
“From 1885 to 1916 the temperature was falling slightly; from 1916 to 1940 it was rising slightly; from 1940 to 1975 it was falling slightly; from 1975 to 1998 rising slightly; 1998 to 2020 there has been no statistically significant change”
11: 1885 to 2016
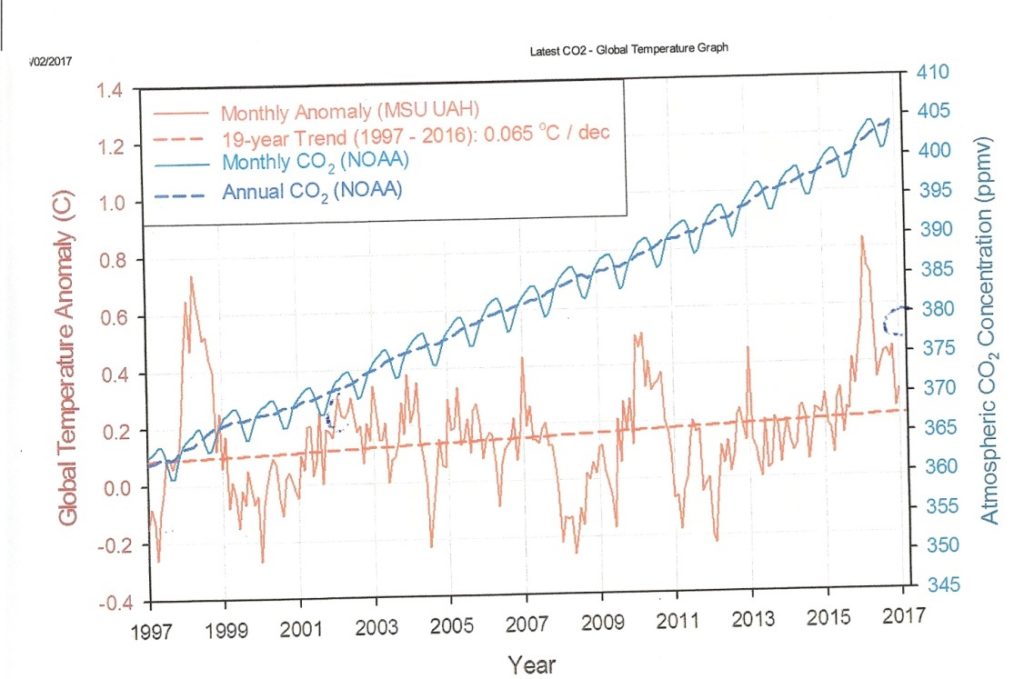
Between 1885 and 2016 the global temperature anomalies varied a little up and down with cold and warm spells. From 1885 to 1916 the temperature was falling slightly; from 1916 to 1940 it was rising slightly; from 1940 to 1975 it was falling slightly; from 1975 to 1998 rising slightly; 1998 to 2020 there has been no statistically significant change. This is shown in the graph below derived from www.WeatherWatch.co.uk, temperature Fahrenheit.
The graph below shows global temperature anomalies 1998 to 2019 published by GWPF January 2020. You can see that there is no correlation between CO2 and temperature.
According to the laboratory at Moana Loa during most of those 138 years the level of CO2 consistently rose and the hypothesis that CO2 creates dangerous global warming was formulated in the period 1975 to 1998. However, you can see that for 53 of those years the global temperature was rising and for 85 of those years it was falling or steady. Why did the temperature fall when CO2 was rising? These temperature changes can only be seen if measured in tenths of a degree This is never reported in the news media.
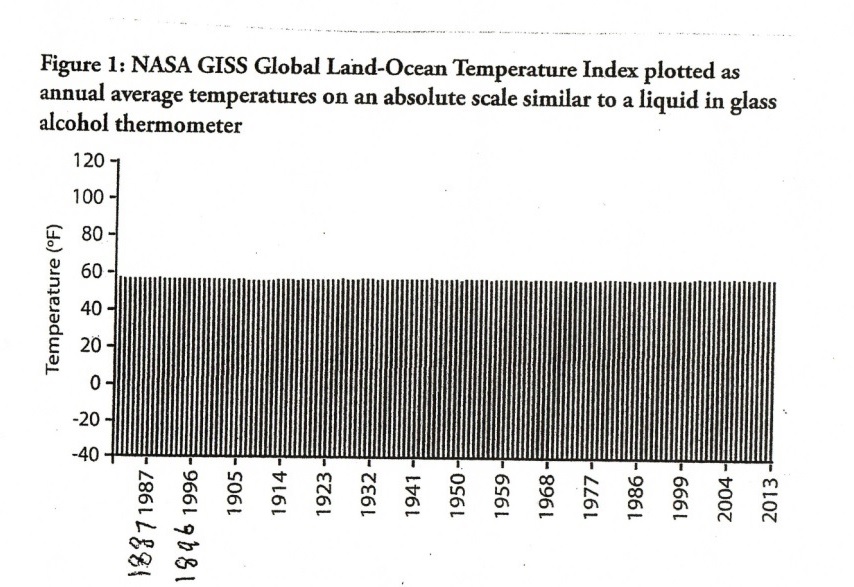
The graph below produced by Anthony Watts shows the changes in global temperature since 1887 converted to a normal wall mounted domestic thermometer.
Source:Plot of NASA GISS global average surface temperature from 1880 to 2013, with thanks to James Sexton for conversion assistance. Data derived from “Global Land-Ocean Temperature Index in 0.01 degrees Celsius, base period: 1951- 1980”, National Aeronautics and Space Administration accessed 10th July 2014 http://data.giss.nasa.gov/gistemp/table.data_v3/GLB.tstdSSTtxt
“warming from 1694 to 1730 was similar to 1988 to 2005. It is interesting to also note that the temperature recorded in 1730 was the same as that recorded in 2008. Until the effect of natural causes of global warming or cooling is established it is impossible to establish the extent of warming caused by manmade CO2 emissions. If any”
12: Global temperatures
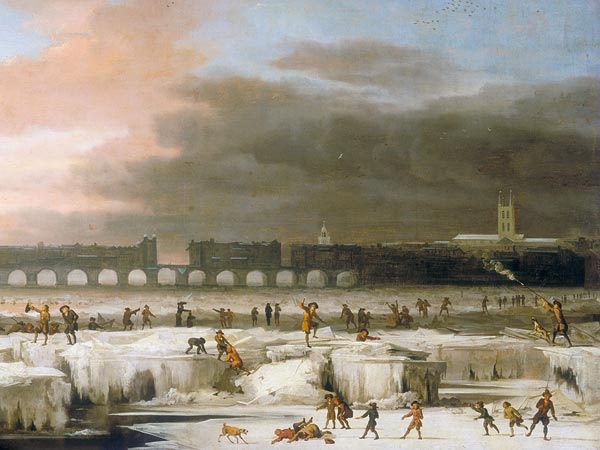
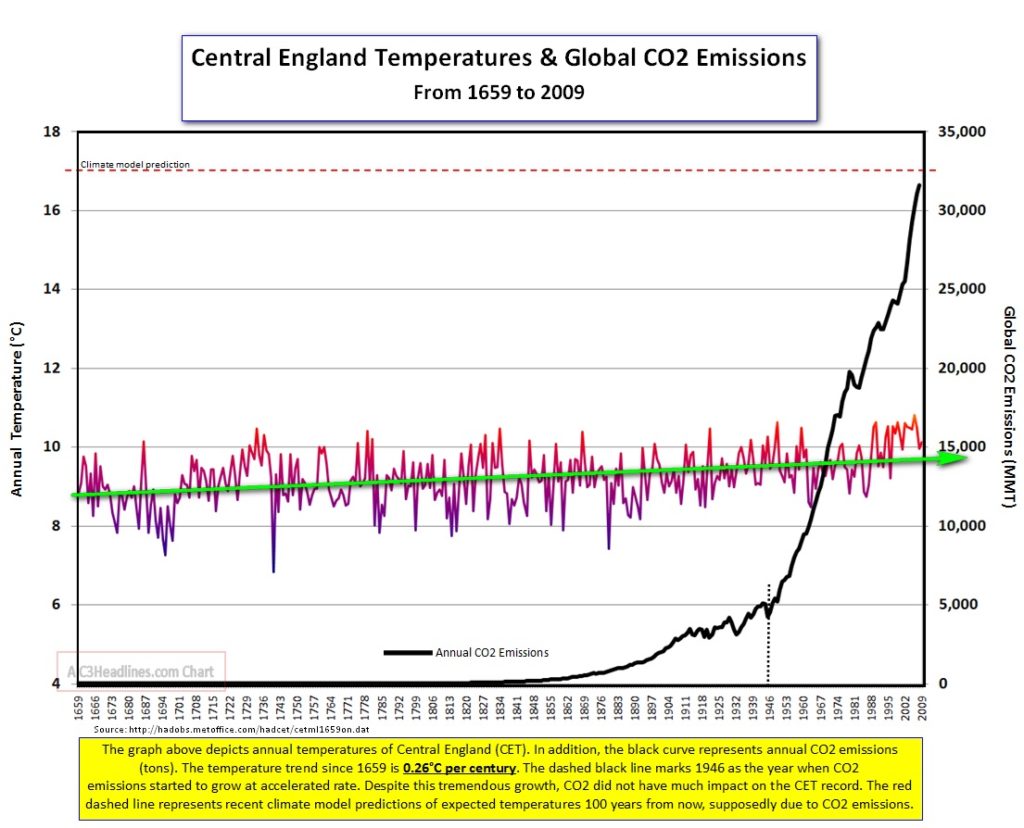
It is clear that global temperatures have risen irregularly since the Little Ice Age (at its coldest 1645 to 1715) when rivers in Europe including the Thames were regularly frozen over. The global temperature has risen at a rate of about 0.3C per hundred years since then. The Central England Temperature (CET) from 1659 shows a rise of approximately 1 degree centigrade. The graph also shows the lack of correlation between CO2 and temperature. Most of that time man produced very little CO2. Natural forces are at work. You can see that warming from 1694 to 1730 was similar to 1988 to 2005. It is interesting to also note that the temperature recorded in 1730 was the same as that recorded in 2008. Until the effect of natural causes of global warming or cooling is established it is impossible to establish the extent of warming caused by manmade CO2 emissions. If any. None of this is ever mentioned in the news media.
13: The reduction in the number of weather stations
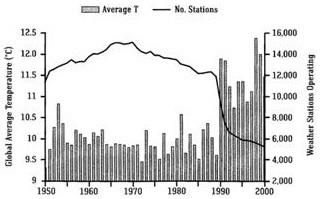
The graph below derived from the National Oceanic and Atmospheric Administration (USA) shows the reduction in the number of weather stations.
Fig. 5 : Evolution of land stations and global temperature. Beginning of 1990, thousands of meteo stations located in cooler rural zones (e.g. Siberia, North Canada) stopped recording data (source :ftp://ftp.ncdc.noaa.gov/pub/data:ghcn/v2/v2.temperature.readme).
The above graph shows a reduction of approximately 8000 weather reporting stations and the effect on global temperature which has created a false warming. This is never mentioned in the AR summary reports of the IPCC. Nor is it reported in the news media.
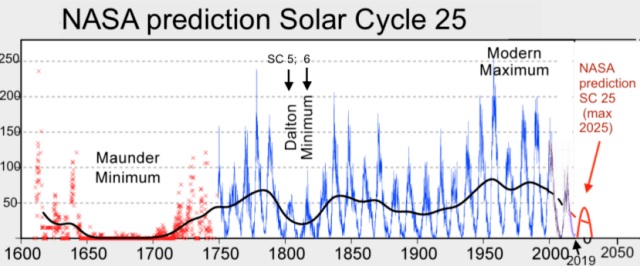
“Both NASA and NOAA have forecast that solar cycle 25 will be the lowest for 200 years. If global temperatures fall to the levels experienced in Solar Cycle 5 during which the Thames froze over at Westminster in 1814 and 1816 the implication is widespread crop failures. No Western government is making preparations for this”
14: What of the future?
Many climate scientists believe that the earth is about to enter a 30 year period of cooling based upon the present low number of sunspots. Records of sunspots show that periods of low sunspots correlate with periods of low temperature. Both NASA and NOAA have forecast that solar cycle 25 will be the lowest for 200 years. If global temperatures fall to the levels experienced in Solar Cycle 5 during which the Thames froze over at Westminster in 1814 and 1816 the implication is widespread crop failures. No Western government is making preparations for this. This is never reported in the news media.
The above painting by Abraham Hondius shows the frozen Thames in 1677.
Daily observations of sunspot numbers from 1st January 1977. Source WDC-SILSO, Royal Observ. Belgium.
The Maunder Minimum coincided with the Little Ice Age; The Dalton Minimum was another period of intense cold during which the Thames froze over in London in 1816. If the prediction by NASA is correct similarly cold temperatures can be expected. The major effect will be widespread crop failures.
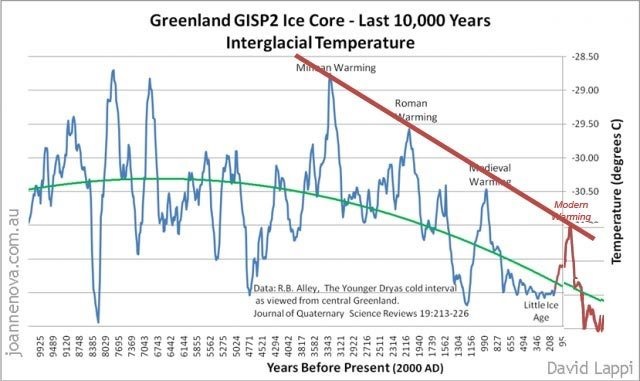
The graph below gives the temperature on the Greenland ice sheet during the last 10,000 years derived from the Greenland Ice Sheet Project 2 (GISP2) ice core. Data source from Joannanova.com.au. The direction of the trend is clear.
Professor Henrick Svensmark of the Danish National Space Institute has demonstrated the connection between sunspots and climate identifying that the flow of cosmic rays varies with the number of sunspots. A low number of sunspots allows more cosmic rays to penetrate earth’s atmosphere. A high number of sunspots reduces them. Cosmic rays ultimately develop into nuclei from which rain drops form thus forming clouds. Clouds cool the earth. Thus low sunspots allow more clouds to form leading to periods of colder climate. This process was confirmed by experiments at CERN.
15: Climate Cycles
Many astronomers and other scientists have determined that climate changes in regular cycles. Research done by Dr. Theodor Landscheit starting in 1976 and studies by Fairbridge and Sanders (Columbia University) show that our climate varies – warm to cold, cold to warm – in cycles about every 180 years giving a double cycle of 360 years. It is thought that this is due to the sun’s motion about the centre of the solar system. Research by Dr. Paul Mayewski on the Greenland Ice Sheet has identified a 1440 year cycle (Journal of Geophysical Research, 30.11.1997) of intensely cold climate which has also been identified in North Atlantic deep sea cores by Bond et al (Science, 14.11.1997). From these cycles it can be deduced that the 360 year cycle, and the 1440 year cycle are due to coincide early in the 21st century. Add to this that the last serious ice age occurred about 11,500 years ago (1440×8) and it looks possible that we are in for serious cooling followed by catastrophic cooling in the not too distant future. No government is considering this.
16: The forecasts
The forecasts of Catastrophic Anthropogenic Global Warming due to increasing CO2 in the atmosphere use computer models which have been severely criticised by sceptical scientists. See the graph below. Until the proportion of CO2 created by natural factors is known the proportion created by man must be unknown. This is never reported in the news media.
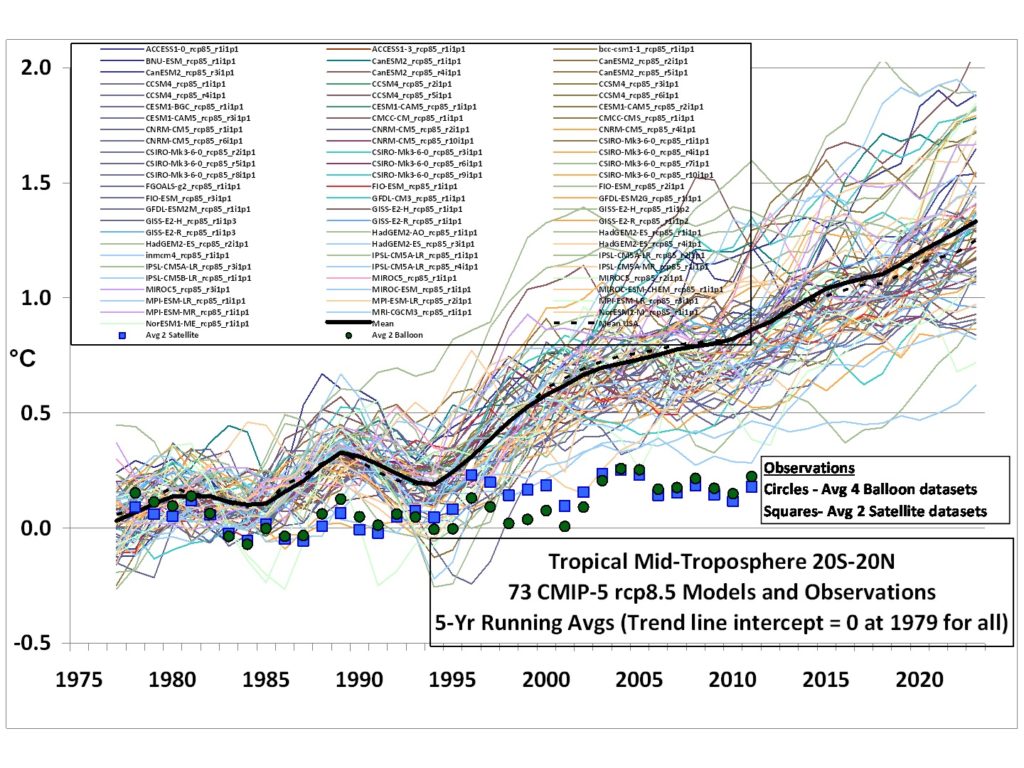
17: Computer models
Computer model forecasts indicate an increase in global temperature of between 2C and 6C by the year 2100. The forecasts of 73 models, upon which the IPCC relies for its Assessment Reports, are given below compared with actual observations of global temperatures 1976 to 2012. This is never reported in the news media.
A similar graph can be found in AR5 Technical Summary figure TS-14 with the following discussion in box TS3: “ However an analysis of the full suite of CMIP5 (Coupled Model Intercomparison Project) historical simulations….reveals that 111 out of 114 realisations show a GMST (Global Mean Surface Temperature) trend over 1998 – 2012 that is higher than the entire HADCRUT4 trend ensemble (box TS3 figure 1a; CMIP5 ensemble mean trend is 0.21C per decade). This difference between simulated and observed trends could be caused by some combination of (a) internal climate variability, (b) missing or incorrect RF, and (c) model response error.” GWPF 6.11.19
18: The Great Barrier Reef, Australia
At a lecture in the House of Lords on 4.11.2019 Dr.Peter Ridd,, who has spent 35 years studying the reef, presented the following: Many of the threats to the Great Barrier Reef, such as from sediments and nutrients from agricultural runoff, and from climate change (either natural or manmade), have been greatly exaggerated. Far from being in very poor condition, the GBR is actually one of the most pristine and unspoiled ecosystems on earth. The manifest discrepancy between alarmist claims and observational evidence is due to a systemic failure of Quality Assurance systems used for science and relied upon for public policy decisions. This was not reported in the news media.
19: 2014 the Warmest Year Ever
The terrestrial record (GISS, NOAA, and HADCRUT) give this impression. Between 1990 and 2000 approximately 8000 weather stations were removed from the record. These were mainly rural stations which experience cooler temperatures than urban stations because of the Urban Heat Island effect. If RSS and UAH satellite figures are used (which are far more comprehensive) 2014 turns out to have been cooler than several other years in the last 18. This is compounded with the fact that the terrestrial data records have been altered to raise modern temperatures and reduce historical temperatures (Report by Prof. F.Ewert). This is never reported in the news media.
“Over the last twenty years various “experts” such as Al Gore have predicted that the Arctic will be ice free before and including 2018. None of the forecasts came to fruition. They still haven’t”
20: Global Sea Ice
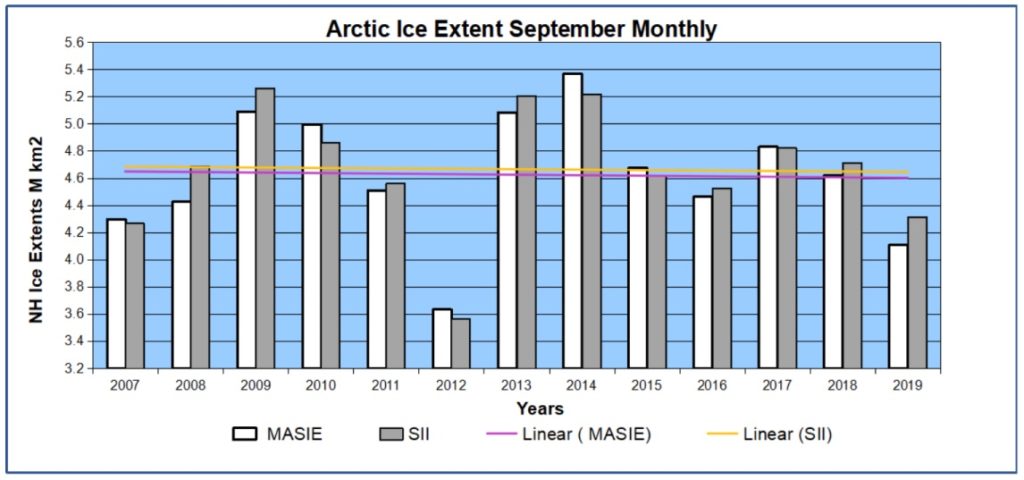
Arctic sea ice and Antarctic sea ice are seasonal. Arctic ice has slowly declined in area for 30 years but in September 2018, was 470,000 square miles (1.2 million sq kilometres) more than it was in 2012. This is more than the area of France, Germany, and Italy combined and illustrates the variability of the arctic ice.
The above graph shows the annual minimum September monthly average sea ice extent in the Northern Hemisphere from 2007 through 2019 according to two different data sets: Sea Ice Index (SII) from NOAA and Multisensor Analyzed Sea Ice Extent (MASIE) from NIC (USA National Ice Centre). The chart begins with 2007 ending a decadal decline and beginning 12 years of stochastic instabilities around a plateau. The linear trend lines are flat for both indices. The volume of ice in the Arctic has no pattern and the SII figure for 30th Sept 2020 is 4.25 million square kilometres. Although this is low it is equal to the combined areas of 22 European states and the trend shown above is not significantly affected.
Over the last twenty years various “experts” such as Al Gore have predicted that the Arctic will be ice free before and including 2018. None of the forecasts came to fruition. They still haven’t.
With regard to Antarctic sea ice January is the Antarctic summer and sea ice extent in 2020 is at the 1979- 1990 average. According to USA National Sea Ice Data Centre the Jan 2020 extent exceeded the level of 16 of the years since 1980. So for 40 years Antarctic sea ice has been variable and is now (2020) higher than it was in 1980. This is never reported in the news media.
21: Polar Bears
Polar Bear population is sparsely spread over the Arctic. The International Union for the Conservation of Nature (IUCN) in 1966 estimated that only 10,000 polar bears remained. In 2006 IUCN estimated that the population had increased to 25,000. In 2017 the number of bears is close to 30,000. Polar bear population does not depend on ice; it depends on the availability of baby seals. This is never reported in the news media.
22: Hurricanes
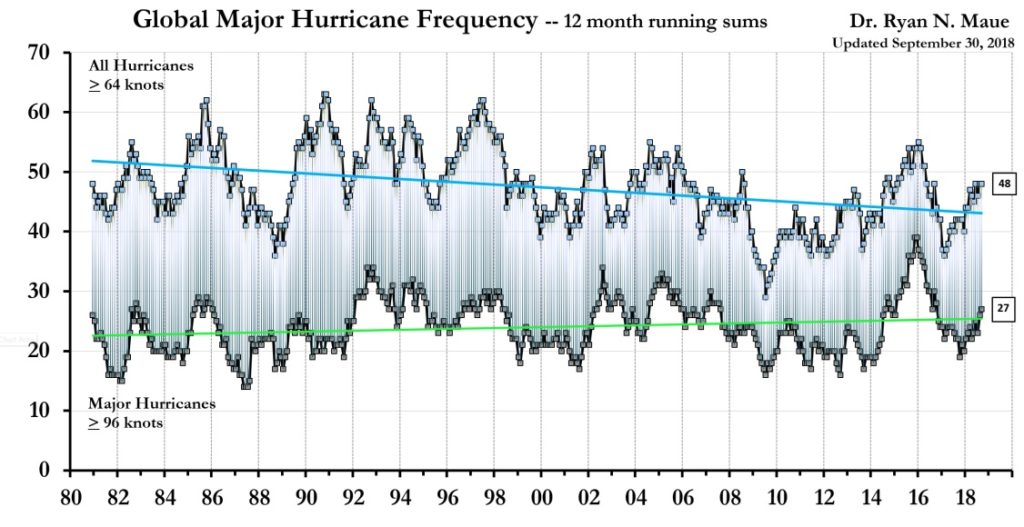
Frequency and intensity is measured using the Accumulated Cyclone Energy Index (ACE). In the last 30 years there has been a steady decline in the number and strength of hurricanes and cyclones which continues into 2020. On a scale of 1 – 5 in the last 10 years only 3 of strength 3 or higher have reached land in the USA. See the graph below.
Global hurricane frequency 38 years. Top line is the number of hurricanes exceeding 64 knots – steady decline over 38 years. Bottom line is number exceeding 96 knots – no significant increase. In that period CO2 increased by approx. 76 ppmv. And the temperature anomaly by 0.2 C
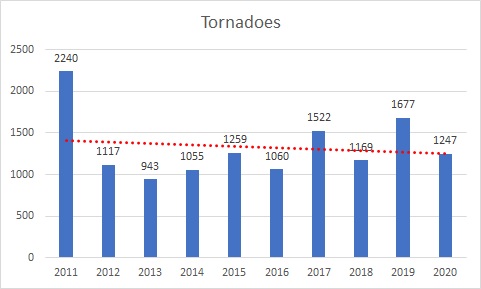
23: Tornadoes
These have been declining in frequency in the last 10 years. As shown in the graph below. The numbers are stochastically irregular but the trend is clearly downwards at present. (source spc.noaa.gov/wcm 1.1.2021)
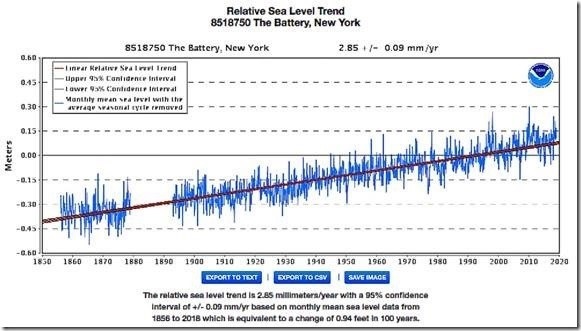
24: Sea Level
The factors affecting sea level are complex: geological, sea temperature causing expansion, and land ice melt. In the last 100 years global sea level has risen by approx. 8 inches. The current rate of increase is about 2 – 3 mm a year and this will cause a rise of about 12 inches by 2100 AD, adaptation is the best approach not the reduction of CO2 in the atmosphere. The graph below shows average sea level at New York 1830 to 2019.
25: Islands in the Pacific and Indian Oceans
A 20 year study published in 2018 has revealed that atolls and low lying islands in the Pacific and Indian Oceans are not at as much risk as has been thought. 709 islands were studied looking at data from the 1940s and it was found that no atoll lost land area and that 88.6% of islands were either stable or increased in area while only 11.4 % contracted. (GWPF 29.11.20)
26: Carbondioxide is plant food
Plants grow by photosynthesis, using water, sunlight, chlorophyll, and CO2 . CO2 is plant food without which there would be no life on earth – it is one of the basics of the food chain and if it falls below 250 molecules per million, plants will struggle to grow. If it falls below 150 molecules per million then vegetation growth is likely to cease.
27: CO2 warming – No Basis in Science
To establish a theory in science it is necessary to follow the Scientific Method. This requires experimental work and the publishing of a paper including all the detailed workings setting out the hypothesis. Other scientists test the hypothesis or compare it with actual observations. If the hypothesis is validated it is accepted as a theory – until someone else disproves it. No laboratory experiment has ever proved that CO2 has the capacity to substantially warm the atmosphere. The New Zealand Climate Science Coalition has offered a $NZ10,000 prize to the first person to prove that man made CO2 can cause dangerous global warming. Similarly, Professor Peter Ward, BA,PhD, of Columbia University, USA, has offered a prize of $US10,000 for the first person to do so. Neither has ever been claimed. This is never reported in the news media.
28: Electric vehicles
In order to unnecessarily achieve net zero carbon dioxide emissions and stop the unstoppable, governments have committed to banning the internal combustion engine and converting to electric vehicles by 2050. In the case of the UK the additional electricity required will require the output of six additional nuclear power stations. This will involve an enormous misallocation of national resources. Furthermore in order to get that electricity to the batteries of the EVs will require the complete rewiring of the UK. Thousands of transformer stations will need upgrading; the distribution cables from the transformer stations to households will need upgrading and this will involve the digging up of almost every urban street in the UK. This will be a further misallocation of £billions of pounds of financial resources and create a massive amount of CO2. The UK government has made no plans for this. This is never reported in the news media.
29: IPCC motivation
The terms of reference of the Intergovernmental Panel on Climate Change are to examine global warming in the light of Manmade CO2. As a result they do not give consideration to scientific reports which identify different causes or which falsify the reports on which they base their hypothesis. A list has been compiled since 2014 by the website No Tricks Zone which details over 3000 scientific papers which express scepticism of the IPCC “science”. They also, apparently, ignore inconvenient empirical evidence.
“Their target is to reach net zero emissions by 2050. They say that net zero provides the opportunity for “intentional societal transformation” and do not hide their belief that capitalism and economic growth threaten the future of the planet”
30: NetZero
Their target is to reach net zero emissions by 2050. They say that net zero provides the opportunity for “intentional societal transformation” and do not hide their belief that capitalism and economic growth threaten the future of the planet. They seek to replace capitalism with top down coercive central planning on a global scale encompassing energy, manufacturing, construction, transportation, agriculture, and land use. (GWPF report 40, Rupert Darwall). Their motivation is political aiming to create a system of world government by the UN general assembly secretariat with real power using climate change as a vehicle. The whole agenda has been hijacked by extremists seeking to undermine the economy and social stability of European countries. (Dr.Peiser, GWPF 10.9.19)
31: The Plan
Their plan was revealed at the IPCC conference in Copenhagen 2009. A draft treaty (see below) was submitted for approval by the conference which in clause 38 provision was made for a 3 part system of control: Government; Facilitative mechanism; Financial mechanism. The details were very intrusive, effectively controlling national economies to achieve UN objectives. In fact a system of world government run by unelected UN officials. The draft treaty was not approved but the cat was out of the bag. For the avoidance of doubt clause 38 of the draft treaty is provided in paragraph 32 below.
32: Draft Treaty
UN Intergovernmental Panel on Climate Change
Copenhagen 2009 Draft Treaty Clause 38
38. The scheme for the new institutional arrangement under the Convention will be based on three basic pillars: government; facilitative mechanism; and financial mechanism, and the basic organization of which will include the following:
(a) The government will be ruled by the Conference of the Parties with the support of a new subsidiary body on adaptation, and of an Executive Board responsible for the management of the new funds and the related facilitative processes and bodies. The current Convention secretariat will operate as such, as appropriate. FCCC/AWGLCA/2009/INF.2 Page 19
(b) The Convention’s financial mechanism will include a multilateral climate change fund including five windows:
(a) an Adaptation window,
(b) a Compensation window, to address loss and damage from climate change impacts, including insurance, rehabilitation and compensatory components,
(c) a Technology window;
(d) a Mitigation window; and
(e) a REDD window, to support a multi-phases process for positive forest incentives relating to REDD actions. (REDD, Reducing Emissions from Deforestation and Degradation)
(c) The Convention’s facilitative mechanism will include:
(a) work programmes for adaptation and mitigation;
(b) a long-term REDD process;
(c) a short-term technology action plan;
(d) an expert group on adaptation established by the subsidiary body on adaptation, and expert groups on mitigation, technologies and on monitoring, reporting and verification; and
(e) an international registry for the monitoring, reporting and verification of compliance of emission reduction commitments, and the transfer of technical and financial resources from developed countries to developing countries.
The secretariat will provide technical and administrative support, including a new centre for information exchange.
Alternative to paragraph 1–38
[The shared vision shall take the form of preambular text that encapsulates both the long-term global goal and pulls together the other elements of the agreed outcome, in the following form:
The Conference of the Parties,
Seeking to further implement the Convention, in light of evolving science and mindful of evolving economic development and emissions trends,
Recognizing, in the light of Article 2 (objective) of the Convention, the importance of identifying one or more reference points in the mid-century timeframe that can guide the efforts of the Parties and the international community and against which aggregate global efforts can be continually assessed,
Considering, in that regard, that [ ] is/are desirable global indicator(s), Having a shared vision of [summary that ties together the elements of the agreement],
33: Conclusions
Many peer reviewed papers have been published putting forward causes for warming other than CO2. However, what is needed to stop the madness that has seized governments around the world, and which is causing enormous misallocation of the world’s resources, is a rational consideration by experts, from both sides of the argument, of the evidence for warming caused by CO2. This is a widely used technique in industry and commerce known as a Red/Blue assessment to resolve a controversial issue. This must be organised preferably independent of any government agency.
Consideration must also be given to the evidence of natural climate change. Until the contribution of natural change to the warming or cooling of the climate is established it is impossible to establish if manmade CO2 has any effect.
Recognition of the true purpose of the UN’s climate change hypothesis must be publicised.
Withdrawal from the targets set by the 2015 Paris Conference and repeal of the Climate Change Act 2008 and subsequent legislation is now urgent.
I have been studying climate change for 12 years by reading books on the subject (I have over 30) and researching scientific papers available on the internet. There is much to say but put as briefly as possible I have come to the following conclusions.
“Those seeking to stop the changes are trying to stop the unstoppable and the policies which have been introduced to achieve this are very harmful to the economy, and the scary forecasts based on computer models are exaggerated”
Climate change is a natural function principally caused by the sun and other factors which are terrestrial, galactic, and cosmic. These influences are very powerful. The climate has changed in the past, is changing now, and will change in the future. Those seeking to stop the changes are trying to stop the unstoppable and the policies which have been introduced to achieve this are very harmful to the economy, and the scary forecasts based on computer models are exaggerated. Models are not evidence and too much real evidence has been ignored by the Intergovernmental Panel on Climate Change, which consists of politicians who write the Executive Summary for Decision Makers. Many of the panel’s own scientists have publicly disagreed with the summaries. They have been sacked or ignored.
I believe it is necessary for the Climate Change Act 2008 to be repealed so that an enquiry can establish what is likely to happen by examination of real historical evidence and then embark on a program of mitigation where the effects are likely to cause economic disbenefits, adaptation where necessary, and development when the effects are beneficial.
“Science is never settled, it merely establishes hypotheses which stand until a future scientist proves them wrong. Science must be established on the principle of the scientific method using real evidence, not models”
Much is made of the claim that “The Science is Settled”. This ignores the powerful forces referred to above. Science is never settled, it merely establishes hypotheses which stand until a future scientist proves them wrong. Science must be established on the principle of the scientific method using real evidence, not models, from which to draw conclusions taking account of the forces mentioned above. No laboratory experiment has ever proved that CO2 dangerously warms the atmosphere.
Those politicians and scientists who promote the hypothesis that carbon dioxide and methane emitted into the atmosphere are causing catastrophic global warming ignore two fundamental facts. The first is that the capacity of those gases to warm the atmosphere is logarithmically reducing. This means that as more and more CO2 gets into the atmosphere the extra gas has less and less effect and we are already at a point where additional CO2 will have only a very small effect. The second fact is that today CO2 forms only four molecules in every 10,000 molecules of atmosphere. In the last 70 years it has increased by one molecule in 10,000. Yes, that is indisputable. I ask the question:- can a change in the nature of one molecule in 10,000 cause catastrophic global warming? I am forced to the answer NO! CO2 can warm the atmosphere a little, but not much. In the case of methane there is less than two molecules in 1,000,000 molecules of atmosphere. This is also indisputable. The principal gas which warms the atmosphere is water vapour the volume of which in the atmosphere is beyond the control of mankind.
“The real empirical evidence shown by the present lack of sunspots is leading many scientists to the view that a cold spell is imminent”
To reduce the cause of modern climate change to only one variable, CO2, and to a small proportion of that variable, is not science. It is pseudo science. The real empirical evidence shown by the present lack of sunspots is leading many scientists to the view that a cold spell is imminent.
In view of the worldwide misallocation of resources I believe that a rational consideration of the factors involved is long overdue, natural climate change must be taken account of, the true purpose of the IPCC CO2 reduction campaign must be publicised, and the Climate Change Act 2008 and subsequent legislation must be repealed.
We are joined by Harry Wilkinson, Head of Policy at the Global Warming Policy Forum. Harry talks about the GWPF and the issues caused by the Government’s policy of net zero carbon emissions. We then chat about the thriving polar bear population and the censorship of those sceptical of the “Climate Emergency”.
On February 2nd the Coulsdon and Purley Debating Society debated the motion “Implementing green policies to combat global warming is imperative to save the Earth”
Mike Swadling opposed the debate, and below is his speech delivered to the society in Coulsdon. As always at this excellent society the debate was good natured, well proposed and drew out great comments from the audience.
“Implementing green policies to combat global warming is imperative to save the Earth” – Opposing motion
In
1970 Harvard biologist George Wald estimated that “civilization will end within
15 or 30 years unless immediate action is taken”
“At
least 100-200 million people per year will be starving to death during the next
ten years.” The Stanford University Professor Paul Ehrlich declared in the
April 1970.
In
January 1970, Life Magazine reported, “Scientists have solid experimental and
theoretical evidence to support…the following predictions:
In a decade,
urban dwellers will have to wear gas masks to survive air pollution
by 1985 air
pollution will have reduced the amount of sunlight reaching earth by one half”
In January 2006 Al Gore predicted that we had ten years left before the planet turned into a “total frying pan.” – anyone else have their heating on today?
In 2008, ABC News predicted that New York City would be under water by June 2015. (1)(2) – Nope didn’t happen
Planet
Earth might quote Mark Twain in saying “Rumours of my demise have been greatly
exaggerated”
The Premise
I
thank the Chair and the members for getting the title right in calling it
global warming. Let’s dispense with the
nonsense called “climate change”.
The
climate changes. Yes we know that. Global temperature is not fixed, we know we
had ice ages, we know we have had warming periods.
I
believe the premise here is the following:
The globe is
warming
The warming
is man-made – if this isn’t as a result of human influenced greenhouse gas
emissions, then the currently prescribed actions are meaningless.
And finally
that the warming will be catastrophic – there is little point in taking action
if the impact is only two more weeks of summer and not much else (3)
To
believe that last two premises you have to believe in the predictions of the people
who told us food would run out in the 1980s and that New York City is currently
underwater.
Now
I’m not convinced we ran out of food or you can swim to the top floor of the Empire
State Building.
It’s
important to look at these in detail, as our civilisation, all of this
abundance you see around you, that has allowed billions of people to move from calorie
insecurity to having commodity goods, in our lifetimes is feed by fuel, mostly fossil
fuels.
It
is our civilizations manna from heaven.
It is a manna showing no end. We
have more oil reserves than all the oil we have ever used, with new technology
opening up even further access to fuel. (4)
If
you have a proven, working, source of fuel that reduces pollution great let’s
use it.
If
you are saying we need to change the basis of our modern civilisation and put
at risk the food supply chains for billions of people, you better be dammed
sure of your predictions.
Getting Warmer
The
first premise on which all others are built is that the world is getting
warmer.
Warmer since when?
Warmer compared to what?
11,000
years ago sitting here would have been cold, very cold. We wouldn’t be under ice, but Scotland,
Wales, Ireland and the North of England all would be.
We
would be linked by Ice to Norway and Denmark, and by Land to France. (5)
Are
we warmer than then – yes. But perhaps
we would all agree that’s a good thing.
As
I’m sure many of you are aware much of our cultural view of white Christmases comes
from Charles Dickens stories rather than our actual memories.
Only
11 times in London in the last 60 years has snow fallen on Christmas day. (6)
(7)
Of
course this was not always so.
The
River Thames held its first frost fair in 1608 and the last was in 1814. These took place during the Little Ice Age
lasting from about 1300 to about 1850. (39)
Clearly
we have warmed since then. The Little
Ice Age started without man made input and ended before any serious global
industrialisation.
It’s
almost as if temperatures change without a man mad cause. Incidentally the Coldest Christmas day on
record since 1659 was in 2010. – so much for global warming.
But
what if I was to pick other dates, different dates to measure warming. What might conclude?
The
English wine market is once again growing, centred in the South East and South
West.
Of
course the Romans grew grapes and made wine at Hadrian’s Wall, not something we could
do today without artificial heaters. (8)
Later
tax
records show the Britons extensively grew their own wine grapes in the 11th
century. (9)
Compared
to then we are colder not warming.
The
later growing took place in the Medieval Warm Period lasting from around 950 to
1250 AD. (10)
The
warming during this period saw the Vikings break out of Scandinavia concur much
of Europe and even grow barley in Greenland. (11)
The
same warming in the east produced more rain, and grass for the grazing animals that
Genghis Khan’s Mongolian horseman rode and feed off.
This
abundance allowed his descendants conquer much of Eurasia. (12)
The Medieval Warm Period was not caused by car journeys, aircraft, coal fuelled power stations or even ‘trial by fire’ used by Saxons. The climate changes it often has little to do with man.
Compared to then we are colder not warming.
Once
again I ask.
Warmer since
when?
Warmer
compared to what?
When
was this ideal period of warmth. Who is
to judge this.
Why
are the starting dates that prove the climate scientist clams we are warming any
more valid than the start dates I have used?
After
all these are the same climate scientists that told us. (13) (14)
In 2002 that
Britain would suffer a “famine” within 10 years.
And that in
2009 we had “eight years to save the planet”
The Scientists
We
are often told Climate Change is Settled Science. Yet Science is knowledge that is testable,
repeatable, observable, and falsifiable. (15) (16)
And
it’s that falsifiable that really matters here.
Science cannot by definition ever be settled.
If
a claim can’t be falsified it’s a matter of faith, of religion, of ideology,
but never ever Science.
We
often here the claim 97% of scientists believe in manmade global warming. But who are these scientists?
It’s
really not clear, where the figure comes from.
One
source of support for this is from the University of Illinoi. A survey which over 3000 scientists responded
to, selected a subset of just 77 who said they agreed that ‘global temperatures
had generally risen since 1800, and that human activity is a “significant
contributing fact”. (17) (18)
Is
this the basis on which to change the modern world economy? On the say of just
77 carefully selected opinions?
Should we give up the industrialisation that dragged our ancestors out of poverty and is still giving the first real hope of a good life to billions in the developing world, on this basis?
Another
often made claim is that “2,500 scientists of the UNs Intergovernmental Panel
on Climate Change, the IPCC agree that humans are causing a climate crisis.”
Except
of course it’s simply not true.
The
number is based on the number of scientist reviewers of all of the IPCC reports. Only 600 were involved in the report with
this statement and proposals. (19)
It’s
not even clear that the 600 all agreed with the outcome of the report.
Whilst
on the subject of the IPCC, their 2001 report featured the Hockey Stick graph. This showed broadly flat temperatures with a
sharp upturn. The graph was used to
prove the need for urgent change.
The
now discredited and dropped hockey stick graph ignored the medieval warming
period and little ice age as if they simple didn’t happen. (20)
We could all show the bank manager a graph of our increasing bank balance if we ignored all our out goings
These scientists simply ignored the facts to make their argument.
To believe in the projections of these scientists you have to believe the Thames Ice fairs didn’t exist and all evidence of farming in Greenland was simply made up.
Are we warming?
I
was in Sydney the first two weeks of December.
From a view point in the Blue Mountains I could see half a dozen fires
over a fifty square area.
It’s
tragic, the loss of humans fighting the fires, and animals is something I am
sure we all agree is terrible.
But
is it anything to do with global warming?
A
1642 expedition saw smoke drifting over the coast of Tasmania and noted
blackened trunks and baked earth in the forests.
In
1770, Captain Cook’s crew saw autumn fires in the bush burning on most days of
the voyage.
Many
of these fires were deliberately set by Aborigines across Australia.
Fire-stick
farming was used to producing lusher grass to fatten kangaroos, they also burned
fire breaks as a precaution against bushfire. (21)
Australia
suffered major bush fire outbreaks in 1851, 1898, 1925, and 1938.
These
occurred before the massive industrialisation in India and China and before any
of the supposed trends for man-made global warming.
Yes
this year’s fires are tragic. Worse than
many remember.
But
the causes are complex, environmentalists have stopped the clearing of land near
residential areas and stopped selective burning to create fire breaks.
And
of course we have Arsonists. New South
Wales Police reported 716 of this year’s fires did not occur naturally. (22)
(23)
After
the hurricane seasons of 2010, 11, and 12 the second and joint third most
active years on record, we were told due to global warming hurricanes would
become common place.
Except
of course in 2013 we had the fewest hurricanes since 1930. The number of storms have been fairly low and
stable ever since.
Around
here we on occasion have some flooding.
When
a story of flooding in the UK hits the news, we hear the familiar cry of
climate change.
Yet
despite heavy and consistent rain this winter we have thankfully had little
flooding. We see the here and now, we
often forget the past was often as bad s.
Much as when Devon and Somerset flooded
in 2013 largely because it appears we stopped dredging local water ways. Natural disasters can have a man-made
component. But let’s not confuse that
with a systemic problem.
Odd natural events happen, they make
compelling stories, but they are not a reason to change the world.
If
the impact of global warming is hard to find it’s worth asking, are we even
warming?
Even
if we ignore the need for an answer to the question “compared to when” and
that’s a massive issue to ignore, are we warming right now?
“Between
the start of 1997 and the end of 2014, average global surface temperature
stalled. This 18-year period is known as
the global warming pause” (24)
Recently
the Met Office concluded the last decade was the second hottest in the past 100
years in the UK, slightly behind 2000 to 2009. – So err I make that we are
cooling decade on decade. (25)
The
official NASA global temperature data shows from February 2016 to February 2018
“global average temperatures dropped by 0.56 degrees Celsius”. The biggest
two-year drop in the past century. (26)
Contrary
to predictions polar bear numbers have never been higher rising 30% since 2005.
CO2
is now at about 412 ppm, or 0.041%. This
plant food is helping the earth become greener.
Despite
the supposedly dangerous level of CO2 of 1 part per 2400. Life has never been better. (27)
Infant
mortality has never been lower.
Life
expectancy never higher.
Poverty
never lower.
An estimated
3.2 billion people, or 42 percent of the total world population, are now in the
global middle class. Many of them
enjoying today in countries we used to consider third world a better standard
of living than some of us grew up with.
Don’t
believe the doom mongers. The world is doing
just great. It’s not clear if it’s
warming, it is clear the scientists predictions are wrong.
Why so wrong?
Why
are the scientists and their political bedfellows getting the predictions so
wrong?
Scientist
is never settled and not about consensus, but scientists are people. They naturally want to be part of the
majority. They want to conform.
For
many years around the middle of the last century many scientists wouldn’t
support the Big Bang theory even as more and more evidence with experiment
substantiated it.
Science
had for some time believed in the steady state theory of the universe. This is had always existed. Many Scientists didn’t want to believe in the
idea of a beginning to the universe because it opened the possibility of a
beginner or a god, something that the then modern science was against.
Yet
the evidence was there. Scientists
understandably being people weren’t following the evidence but rather the
sticking to the ruleset they had been brought up in. (28)
Scientists
now, are driven by grants and agendas to support global warming. When your economic self-interest is driven by
a viewpoint it becomes easier to follow that viewpoint.
Between
1989 and 2009 the US Federal Government funded to the tune of $1.6 billion and
year climate studies. (29) Clearly no
one was expected to find no change to keep the money coming in.
I
am not suggesting corruption in these cases, more I am simply noting it is much
easier for your research to find the required answer when paying your mortgage
depends on it.
Where
there was clear corruption however was with the 2009 Climategate scandal. Leaked emails from the University of East
Anglia Climatic Research Unit, showed a number of scientists collaborating to
manipulate data.
This
manipulation included:
Changing
data to show a 156 year warming trend in New Zealand that simply hadn’t happen.
Eliminating 75%
of the world’s temperature stations from new data with a clear bias toward removing
higher-latitude, high-altitude locations. (30)
There
are a number of possible reasons politicians push the climate change agenda.
The
Chinese like it because we hamper western industry whilst they continue to
build a new coal fuelled power station every other week.
Many
of our politicians like that all solutions to global warming require more taxes,
and power for the politicians, and less rights for the people to make choices
in their own lives.
They
also like the new jobs it creates and the power they have to disperse them.
Croydon
Council recently announced it has a appointed a lead for their Climate Crisis
Commission. They can’t collect the bins
on time, planning is a joke but the council can appoint people to a Climate
Commission. (31)
Some
like Al Gore I suspect do it simply for the money. Why else would you preach climate catastrophe
and rising sea levels whilst spending $8,8million on an ocean front villa with
six fireplaces, five bedrooms and nine bathrooms. (32)
You
either believe the oceans are rising or you buy a beach property, surely not
both.
It’s
not so clear why so many celebrities and indeed some of our own royalty are so
keen to push green policies. My own view
is they simply don’t like the plebs spoiling the holiday destinations.
I
would not normally be some unkind in assigning motive, but I can simply find no
other reason to understand how you can fly by private jet to a climate change
camp where you then deliver a speech about the environment while barefoot, as
Prince Harry did last year. (33)
Why
else would Emma Thompson fly the 5,400 miles from LA to London to support the Extinction
Rebellion protests? (34)
Can
I ask your indulgence for a show of hands on who has flown in the past year….
Multi-Millionaires
Al, Harry and Emma, want to stop you doing that.
And
they are so determined that they won’t stop buying mansions or jetting around
the globe, until they have stopped you having your annual fortnight in the sun!
What to do?
We
all want to live in a good environment, we want to improve the world around
us. The best way to do that is to simply
let people get rich.
Poor
nations and peoples care little for the environment, survival rightly takes precedence.
As
nations like us move to the post industrial age, and we value experiences more
that things, we use less carbon.
Our
carbon output per person has gone down for 6 years, this has little to do with
direct green policies, and much to do with technology improvements. (35)
New
Zealand is planting a billion tress, partly because they can afford to. (36)
The
amount of land used to produce food for the every growing population is stable,
and in the west reducing, with some being returned to the wild. New science, actual science not computer
models has made this possible. (37)
We didn’t face starvation,
our cities are still above water, and you are still at risk of polar bear
attack in the icy north pole.
We are warmer than two
centuries ago, but colder than when Genghis threaten much of the globe. The biggest threat many face today is in a
massively reduced standard of living following the policies preached to us by
the rich and powerful.
Life is good, and getting
better.
GDP per capita in Africa has
increased in real terms by 60% since the year 2000, by 50% in Latin America,
and doubled in Asia.
That’s a real terms increase
in prosperity. Why would you want to change
that?
Why would we want to put at
risk the abundance we have based only on the predictions and fear of those so
often proved wrong?
Summary
The world is doing well, people’s
lives which were through all of human history an immense struggle are
improving, all over the globe.
Let’s not throw that all away
for fanciful and consistently wrong computer models.
Nigel
Lawson sums up the situation well.
‘The
fact remains that the most careful empirical studies show that, so far at
least, there has been no perceptible increase, globally, in either the number
or the severity of extreme weather events. And, as a happy coda, these studies also show
that, thanks to scientific and material progress, there has been a massive
reduction, worldwide, in deaths from extreme weather events.’
In
some ways worse that the economic impact of the global warming scare is the
impact to the mental health of the next generation of adults.
According
to the Royal College of Psychiatrists there is now a condition called eco-anxiety.
Talk
of a ‘climate crisis’ has led to an upsurge in young people reporting feelings
of anxiety, helplessness and guilt. (38)
This
Christmas Channel 4 screened a special edition of Gogglebox with children
watching claims by Extinction Rebellion that ‘scientists say we have only 11
years to act’.
One
child counted on her fingers how many years she had left to live and worked out
that, the world could end when she was just 19.
One
mother described how her daughters had asked what the point was in taking their
GCSEs if they weren’t even going to be here a few years later.
We
are all old enough to know to ignore Prince Charles when he says the world is
ending in just 11 years, someone who is 11 years old is not.
Incident
the Prince said that the world was ending in 11 years, over 11 years ago.
Children
are easily influenced. Especially once teenagers
they like little more than to tell their parents how wrong they and their whole
generation is.
Telling children the world will end before they get to be adults is immoral, it damages their mental health and has been proved time and time again patently false.
Naturally
want to be part of something big, we like to think our influence on the world
around us is greater than it really it.
The
world is just fine, humanity is doing great.
Keep
the bureaucrats out the way and the natural inventiveness of mankind will
ensure things keep getting better.
Leave well alone and lets enjoy the great world we live in.
2018 has seen another great push for action on Climate Change. This included the International Panel on Climate Change (IPCC) issuing a report warning that the world has:
Among the report’s recommendations are that we move away from eating meat, dairy and eat locally sourced food (yes we have no bananas). It also recommends that we annually spend $2.4 trillion on greening the energy system between 2016 and 2035. This equates to over 3% of global GDP.
They warn that the world is currently 1 degree C warmer than pre-industrial levels. This report was covered as if holy writ by the mainstream media across the globe, but the basic premise of the report raises some interesting concerns.
Tree rings show that between 1211 and 1225 was a period of sustained rainfall and mild weather which coincided precisely with the meteoric rise of Genghis Khan’s empire.
We are being asked to commit to a further loss of national sovereignty and join a global $2.4 trillion effort on climate change that would necessarily impose changes of diet on the British people. For this to happen I believe the following 3 tests must be passed.
The globe is warming – the climates always changes, only the original concern of global warming is meaningful.
The warming is man-made – if this isn’t as a result of human influenced greenhouse gas emissions, then the prescribed actions are meaningless.
The warming will be catastrophic – there is little point in taking action if the impact is only two more weeks of summer and not much else.
The answers to these tests must be a matter of science not feelings or politics. Credit must go to Dennis Prager and his show for these.
Does the sciencesupport that Catastrophic Man Made Global Warming ishappening?
Addressing the first test ‘the globe is warming’. The official NASA global temperature data shows from February 2016 to February 2018 “global average temperatures dropped by 0.56 degrees Celsius”. The biggest two-year drop in the past century, but you may not have heard this in the media. Global temperatures have not increased for much of this century.
Is the warming catastrophic? Bjorn Lomborg, Director of the Copenhagen Consensus Centre and a believer in man-made global warming doesn’t seem to think so https://youtu.be/3PWtaackIJU. Nigel Lawson sums up the concern of catastrophic climate change in his paper The Trouble with Climate Change when he says:
‘The fact remains that the most careful empirical studies show that, so far at least, there has been no perceptible increase, globally, in either the number or the severity of extreme weather events. And, as a happy coda, these studies also show that, thanks to scientific and material progress, there has been a massive reduction, worldwide, in deaths from extreme weather events.’
So is the scare about ‘climate change’ really a question of science or politics? Patrick Moore who helped to create Greenpeace, and then left it, explains in this video https://youtu.be/BpBnJq19R60 ‘What began as a mission to improve the environment for the sake of humanity became a political movement in which humanity became the villain and hard science a non-issue’.
We often hear 97% of scientists agree that climate change is real. Alex Epstein, founder of the Centre for Industrial Progress, reveals the origins of the bogus “97%” figure Do 97% of Climate Scientists Really Agree?
Whilst it is clear the climate is changing, it is not clear that Catastrophic Man Made Global Warming is happening. What is however clear, is that we shouldn’t squander our sovereignty and wealth on a battle that will impoverish the developing world, and strip us of freedoms we enjoy today.